
On Tuesday, the Ministry of Finance (MOF) published a report on income inequality in Singapore. This report is an update of an earlier paper published in August 2015. We first heard that the government planned to do this updated report following an MOF response to a Parliamentary Question by Leong Mun Wai in January 2025. The 40-page report provides very comprehensive information. Before we examine what it reveals, we must first define some of the terms the report uses.
Terms Used In The Study And Reflected In This Article
Citizen Household / Resident Household
A citizen household is defined as one where the household reference person is a Singapore citizen. A resident household is defined as one where the household reference person is a Singapore citizen or permanent resident.
Household reference person used to be known in previous surveys as the “head of the household”. It’s since evolved to refer to “the oldest member, the main income earner, the owner-occupier of the house, the person who manages the affairs of the household, or the person who supplied the information pertaining to other members”.
Transfers
According to the report, transfers refer to benefits related to housing (including capital grants), employment and training, education, healthcare, social support, childcare, marriage & parenthood, and Special Transfers. It is a really broad category that includes everything from CDC vouchers to CPF Housing Grants, from MediSave top-ups to U-Save rebates.
Read Also: Step By Step Guide To Redeeming Your CDC Vouchers
Taxes
Taxes refer to personal income tax, goods & services tax (GST), vehicle-related taxes, property tax, foreign domestic worker levy, stamp duty, and other indirect taxes.
#1 Based On Employment Income Alone, Singapore’s Income Inequality Is Decreasing
The Gini coefficient is a statistic that essentially measures the distribution of income or wealth on a scale of zero to one. A Gini of one represents perfect inequality, where one household has all the wealth, while a Gini of zero represents perfect equality, where every household has the same income.
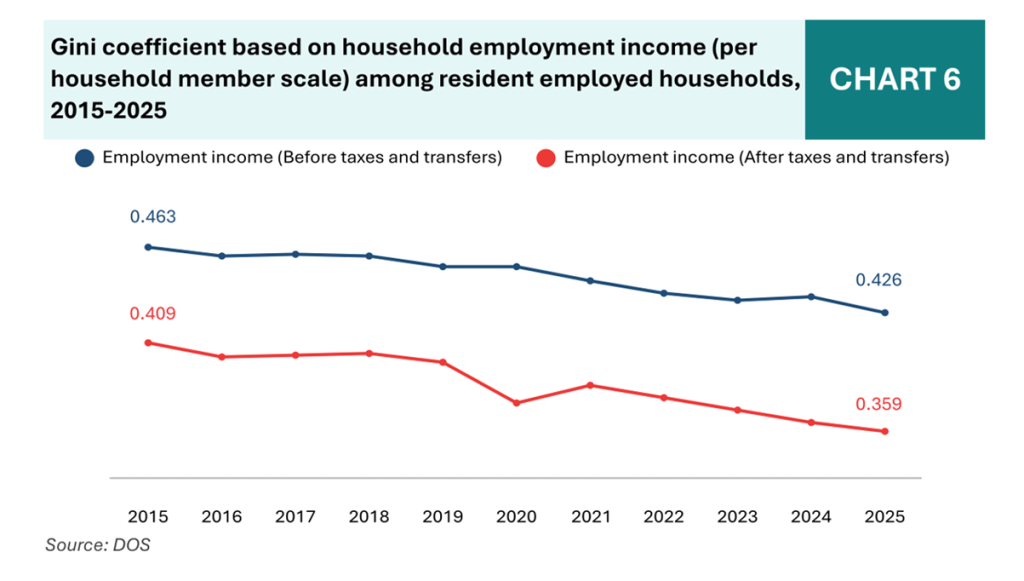
Singapore’s Gini coefficient based on employment income, which is what has been used for years, has been falling over the past 10 years. It is currently the lowest its ever been, both before and after taxes and transfers, at 0.426 and 0.359 respectively.
One notable limitation of this measurement is that it examines “resident employed households”. This refers to households in Singapore with at least one employed person; it excludes retirees and households with no Singapore citizens or permanent residents, such as families here on Employment Passes or migrant workers.
Read Also: Why Singapore Employers Need To Be Prepared For An Older Workforce
With these limitations in mind, the report also attempts to look at the Gini coefficient in another way.
#2 The Challenge Of Measuring Income Comprehensively
One aspect of the report that came across clearly was the difficulty of measuring income in Singapore. For many years, only employment income data was comprehensively and regularly captured. However, as Singapore’s affluence grows and our population ages, that data alone won’t tell the whole story.
That is why the Department of Statistics has been working to improve data on non-employment income, which includes CPF LIFE payouts, rental income, and investment returns. Adding this non-employment income to employment income creates a new data series known as market income.
Under this new market income data, Singapore’s Gini coefficient follows a similar falling trend as employment income.
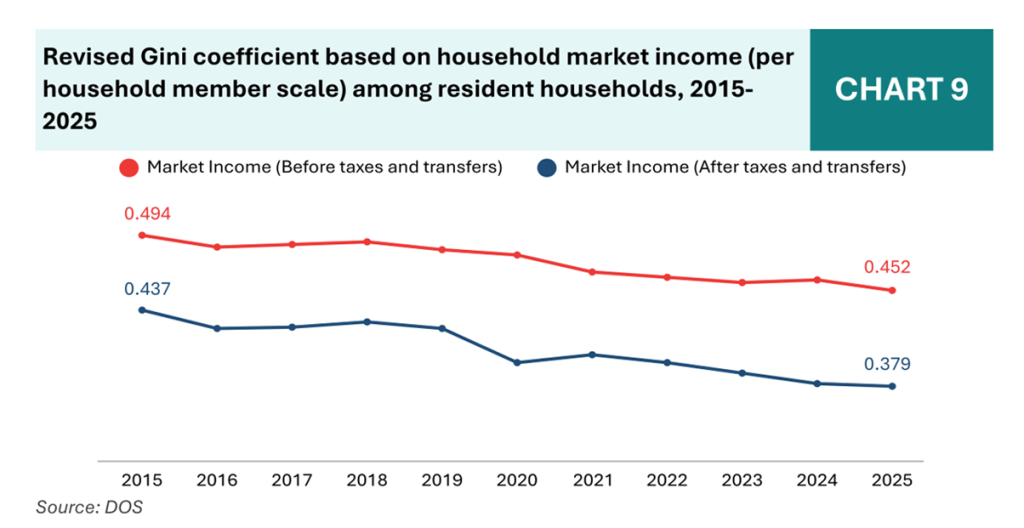
The report notes, however, that the values exceed those based on employment income alone. This suggests that income inequality in Singapore is higher when non-employment income is included, even after taxes and transfers.
Notably, this Gini coefficient also better reflects a broader survey of households in Singapore by looking at “resident households”, i.e. including those with no employed members.
For most of these resident households, employment income accounts for 70%-80% of total income. However, for the bottom 20% (i.e. the 1st and 2nd deciles), non-employment income is a significantly bigger proportion. This may imply that retirees with lower incomes can rely on non-employment income, which may be as much as 4 times their employment income.
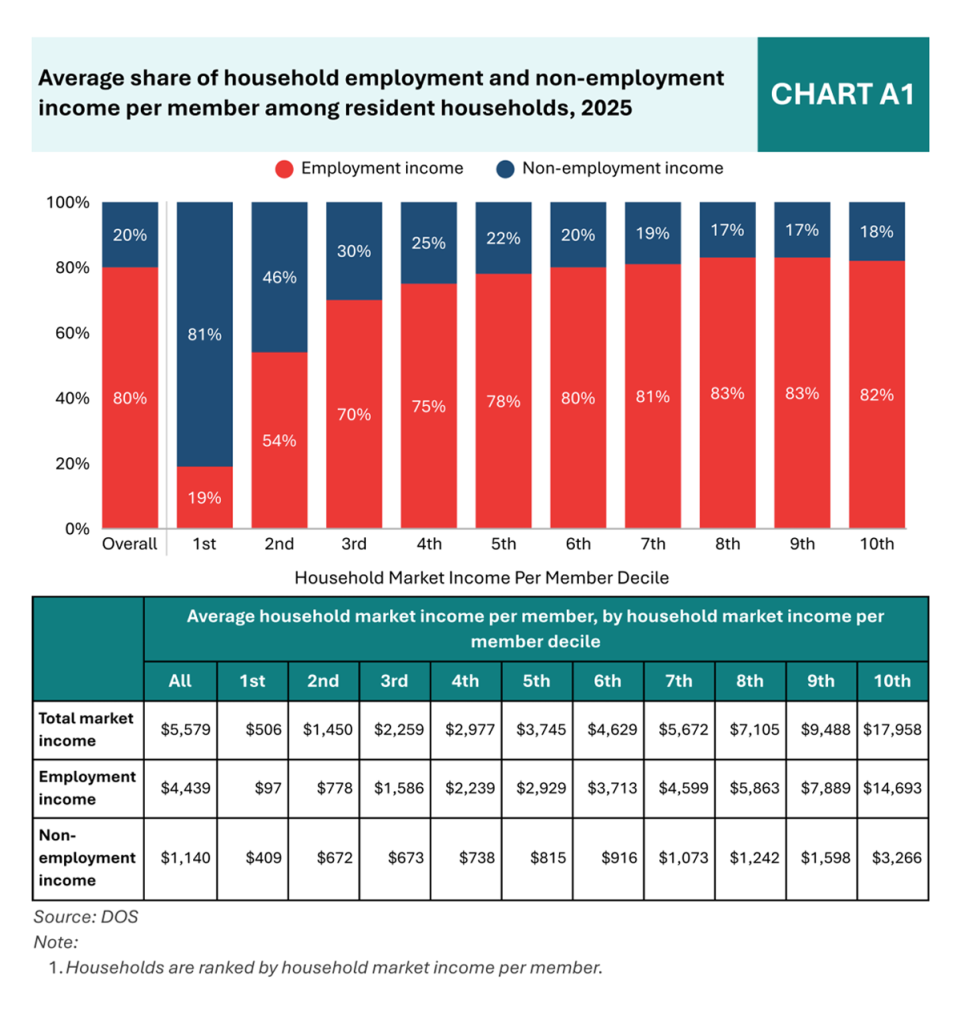
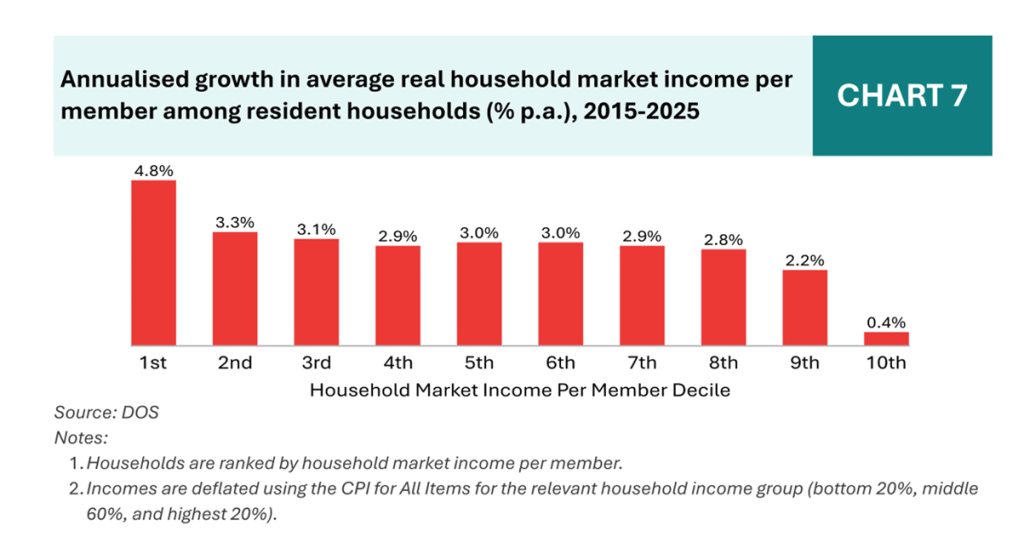
The numbers, however, seem to tell a different story. Those with the lowest employment incomes have less total market income than the non-employment income of the next lowest group. The average household market income in Singapore ranged from $506 to $17,958 per member in 2025.
That said, annualised growth in average market income is rising across all income categories, with stronger growth among the lower income. In another 10 years, we can hopefully expect these income gaps to narrow further.
#3 CPF Balances Make Up 30% Of Most Household Wealth
It would appear that across all households, the distribution of wealth components appears largely similar, with property equity making up about 50% or more of household wealth.
However, for most resident households in Singapore, net CPF balances make up 30% or more of household wealth. This is not the case for the top 20%, where CPF balances make up only 15% of household wealth.
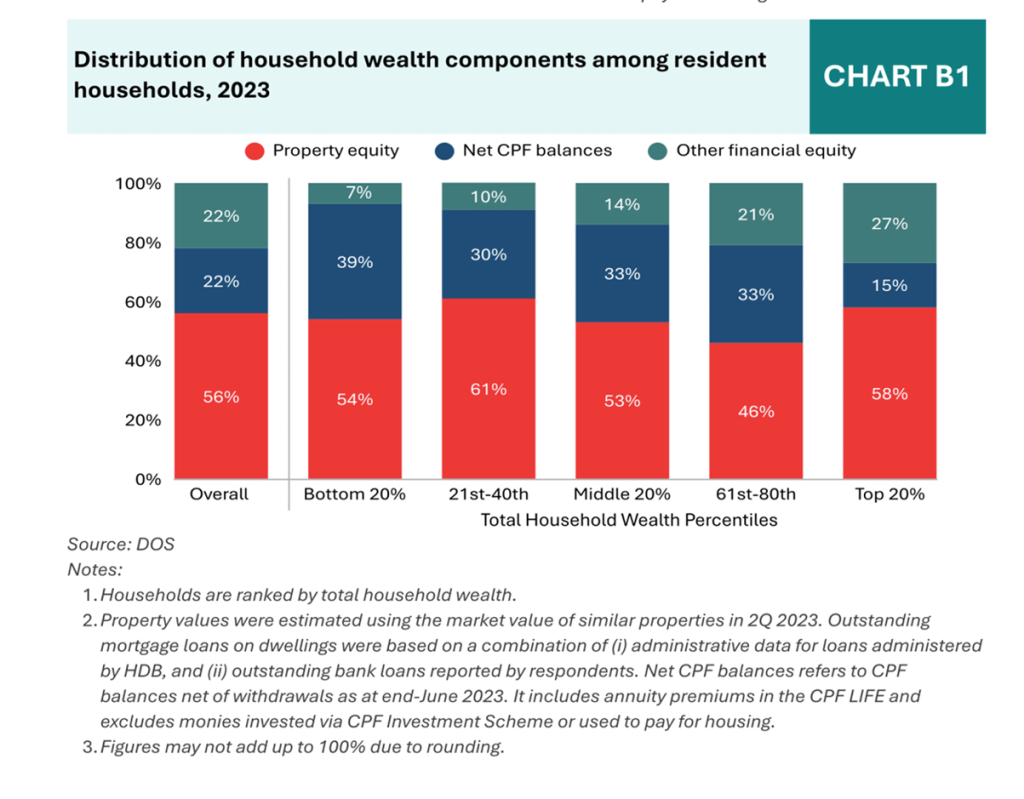
For many of these households, however, property asset values and net CPF balances in Singapore aren’t liquid. When resident households are grouped by household wealth, these two asset components account for 93% of wealth among the bottom 20%, but only 73% of wealth among the top 20%.
#4 Wealth Inequality Is Most Obvious When Looking At Property Asset Value
This should not come as a surprise to most Singaporeans, but it’s still rather surprising to see the actual numbers presented in this way. In 2023, the average total wealth of the top 20% far exceeded the average total wealth of the remaining 80% of households combined.
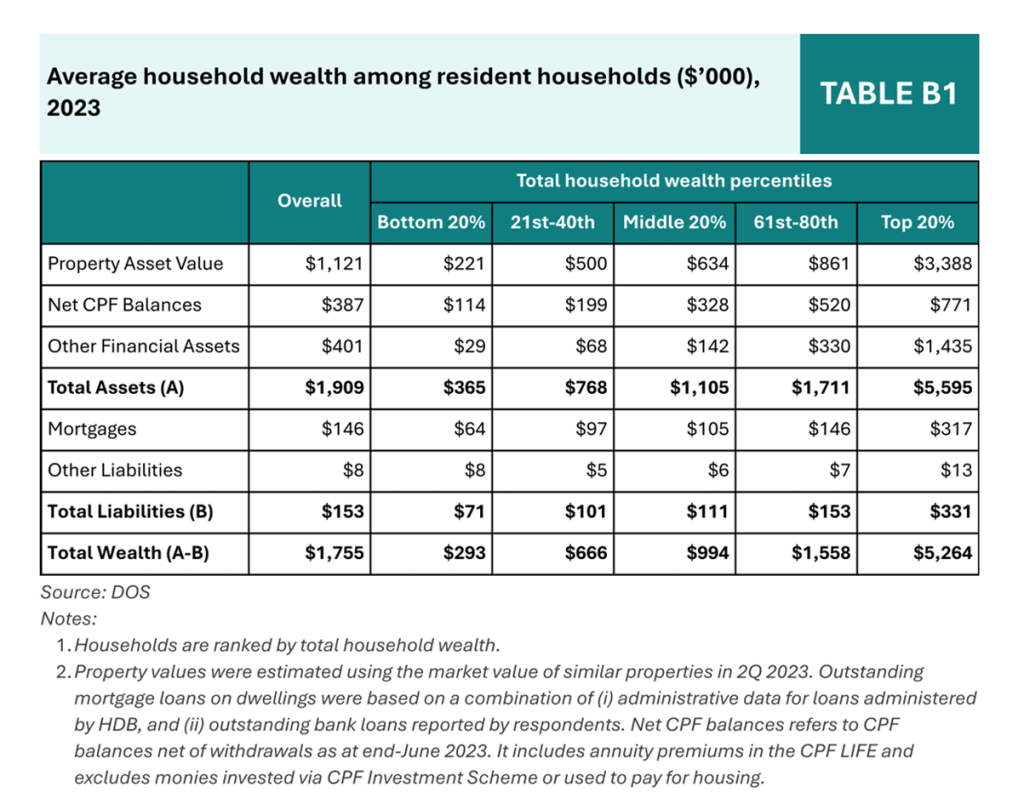
This is due to two reasons. Chiefly, the average property asset value of the top 20% in 2023 was $3.388 million, compared to the average property asset value ot the next highest group at $861,000. However, it is also notable that the average outstanding mortgage loan for the top 20% is $317,000 (9.3% of property value), whereas the average outstanding mortgage loan for the next highest wealth group is $146,000 (almost 17% of property value).
In other words, not only do the top 20% have significantly higher property values, but they also have a significantly smaller proportion of outstanding liabilities, compared to the rest of resident households in Singapore.
Again, this data is grouped by total household wealth, with property asset values and net CPF balances accounting for a significant share of total assets. For many of resident households in Singapore, such wealth isn’t liquid.
In other words, it is true that in Singapore, “home ownership and policies that support wealth accumulation have resulted in a very small share of the population with negative wealth”. However, a better reflection of wealth inequality in Singapore is perhaps looking at the ratio of “other financial assets” to “other liabilities”.
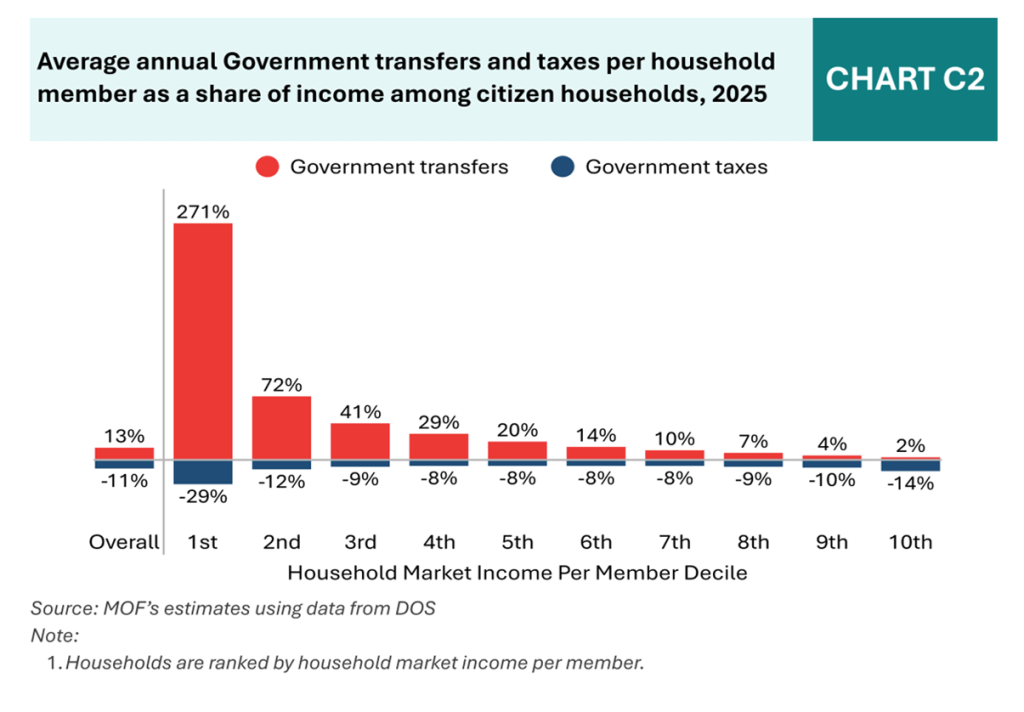
#5 The Highest Income Households Pay More Tax Than Almost All Other Households Combined
Among citizen households, the highest income earners (i.e. the 10th decile) pay almost as much tax as the bottom 80% of citizens combined. A citizen household is one where the household reference person is a Singapore citizen.
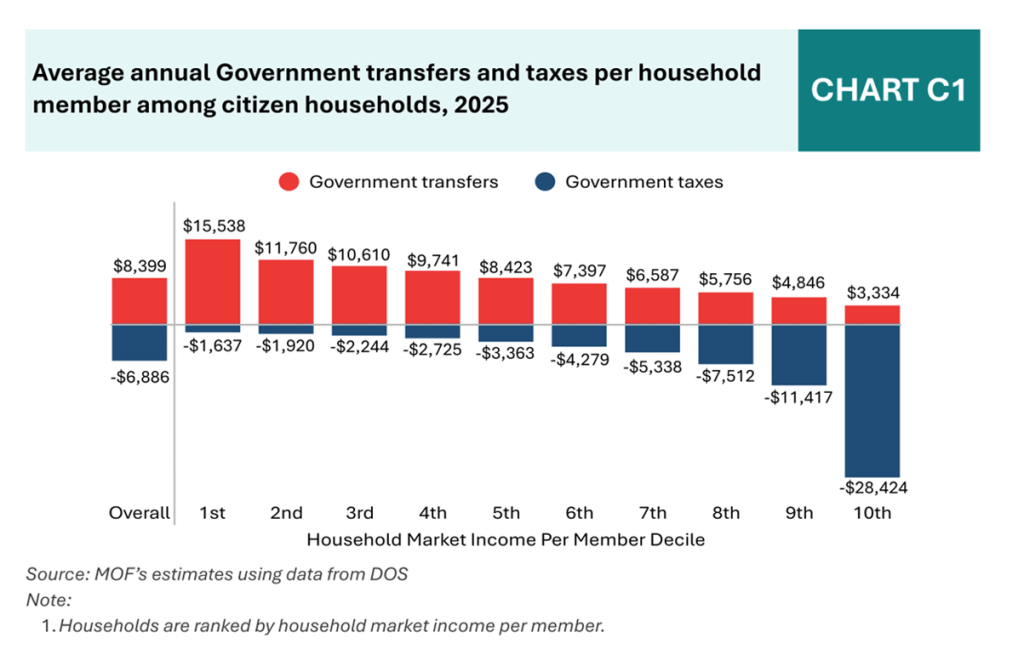
When taxes and transfers are displayed as a share of income, however, the charts look quite different. The lowest income earners (i.e. the 1st decile) pay 29% of their annual income in taxes, the highest proportion of income among all the households. However, they also receive 271% of their annual income in government transfers, which is again, the highest among all citizen households. In other words, although our taxes penalise households on both ends of the income spectrum more, our overall tax and benefits system is progressive. In Singapore, households with higher income pay more taxes and therefore contribute more to government revenue, which benefits the lower-income households.
Read Also: The Rise of HENRYs: Why High Earners Still Don’t Feel Rich In Singapore
What The Singapore Government Is Committed To
Ultimately, the Government recognises that Singapore, like many other countries, is grappling with widening inequality. It has therefore made it a priority to mitigate inequality, including a progressive system of property taxation, and ensuring lower-income households and individuals receive targeted benefits. Under the Forward Singapore exercise, launched in 2022, the Government will “work closely with individuals, families, communities, and businesses, to advance our shared objectives, and sustain inclusive growth for the benefit of all Singaporeans.”


Bonds and Fixed Income
StashAway Income Portfolio: How You Can Earn 4.6%* Dividends From Your Investments Each Year


