
Every ten years, Singapore’s General Household Survey offers a mid-decade snapshot of how households are doing on a variety of topics. The latest edition, was published in June 2026, paints a fascinating picture of how incomes, residences and careers have changed from 2020 to 2025.
All charts and data below are taken from the General Household Survey 2025 report.
#1 Monthly Household Market Income Rose From 2020 To 2025
The survey shows that median household market income has risen in both nominal and real terms. Market income is a relatively new term that refers to income received by households before Government transfers and taxes.
It was first used in the annual Key Household Income Trends 2025 report, published earlier in February 2026, and it better reflects household income by looking beyond employment income to sources such as rental income, investments, and annuities. The Department of Statistics has been collecting this data since 2015.
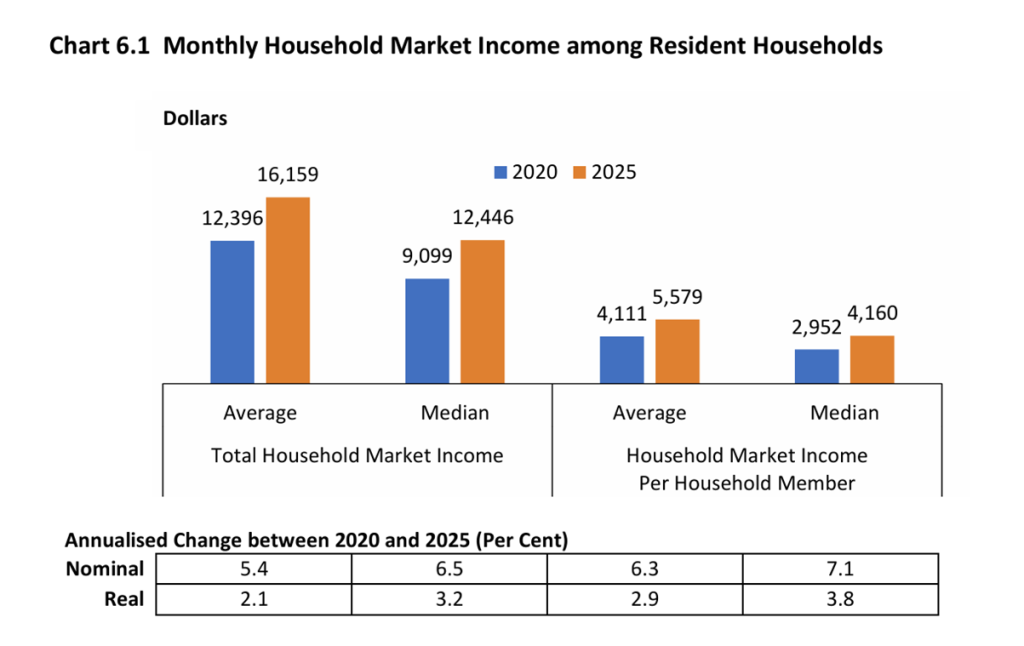
Resident households in Singapore are therefore earning more in 2025 than they were in 2020. The median total household market income in 2025 is $12,446 per month, up from $9,099 per month in 2020. Even in “real” terms, after factoring in inflation, households are earning 3.2% more in 2025 than in 2020.
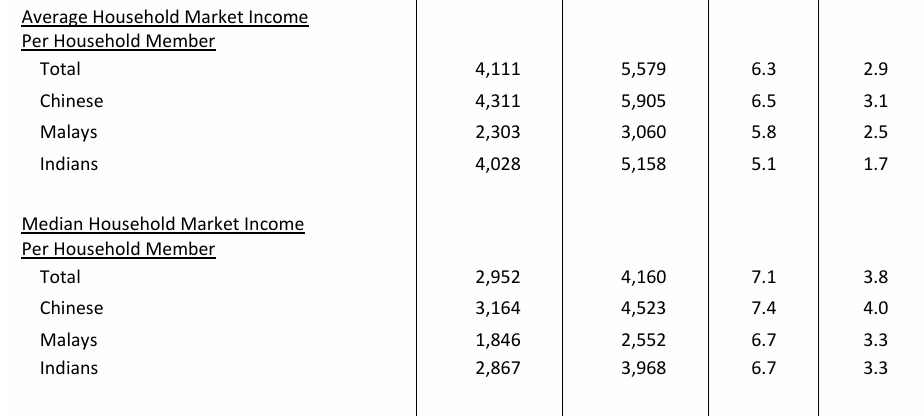
When divided by household member, the difference is even more pronounced. The median market income per household member is $4,160 in 2025, up from $2,952 in 2020. In real terms, after factoring in inflation, this is a 3.8% increase.
Read Also: 5 Things We Learnt From MOF’s Income Inequality Report
#2 About 1 In 7 Resident Households Earn $30,000 Or More A Month
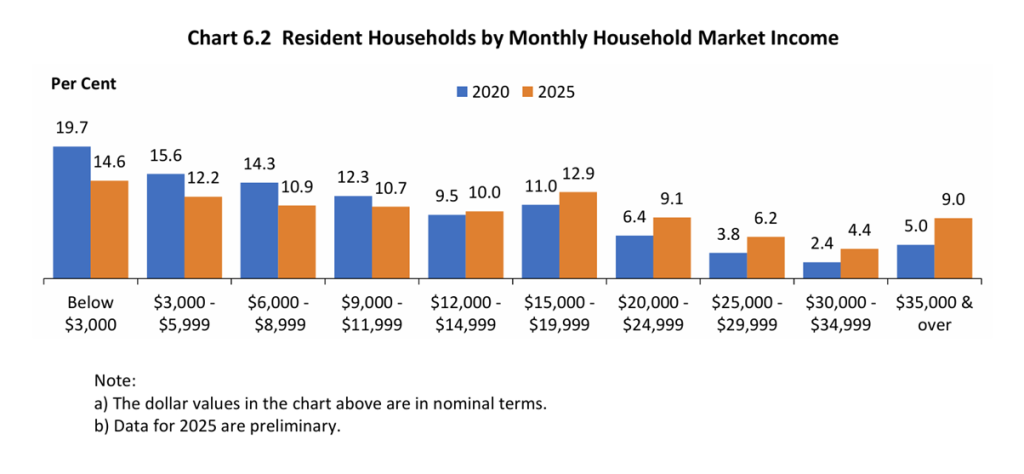
This is the statistic that made headlines, and the chart shows that 4.4% of households earn between $30,000 and $35,000, while 9% of households earn $35,000 or more.
Overall, the proportion of resident households earning more than $12,000 a month has increased between 2020 and 2025.
The chart also shows that about 1 in 7 resident households earn less than $3,000 a month in terms of household market income in 2025. This proportion has declined since 2020, when almost 1 in 5 resident households earned less than $3,000 a month.
Read Also: What Is The Household Income For Singapore Families? (Based On Flat Types, Household Members)
#3 All Three Ethnic Groups Experienced Growth In Household Market Income
Singapore’s classification of ethnic groups into Chinese, Malay, Indian, and Others, better known as the CMIO framework, has been in place since colonial times. In Parliament in 2025, it was reiterated that “the Government works with self-help groups to uplift low-income households and the less privileged within the various racial communities.” The CMIO framework “has also allowed the Government to monitor the outcomes of the various groups, and provide more targeted interventions. These will be more difficult to do without the CMIO framework in place.”
When diving into median household market income per month for each major ethnic group, we see that Indian households have experienced the largest increase between 2020 and 2025, with a real annualised change of 3.5%. Median household market income for Chinese households increased by 3.1% and Malay households by 2.3%
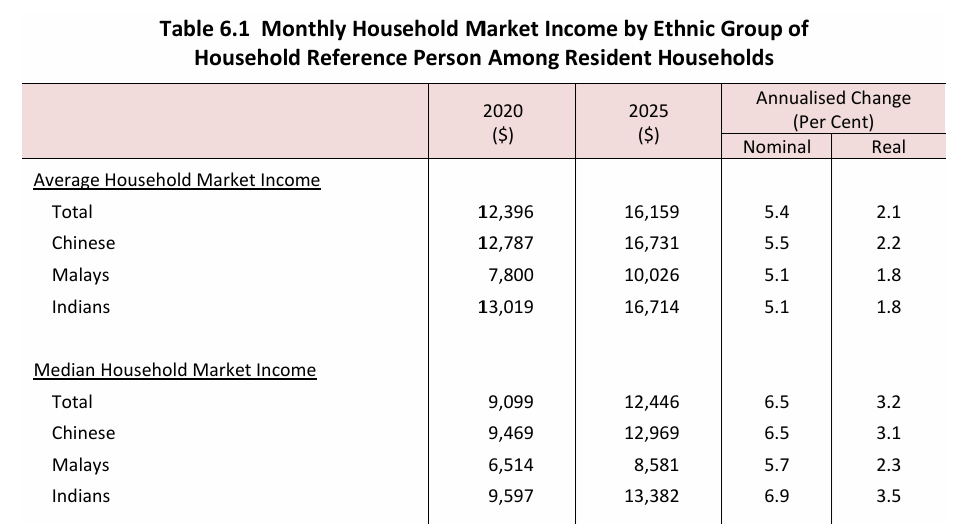
When broken down further into household market income per household member, however, median household market income per month is higher in Chinese households at $4,523, an increase of 4.0% from 2020 after adjusting for inflation. Median household market income per household member in Indian households was $3,968 per month, an increase of 3.3% from 2020 after adjusting for inflation. Median household market income per household member in Malay households was $2,552 per month, an increase of 3.3% from 2020 after adjusting for inflation.
#4 Proportion Of Household Market Income From Investment Income Has Increased
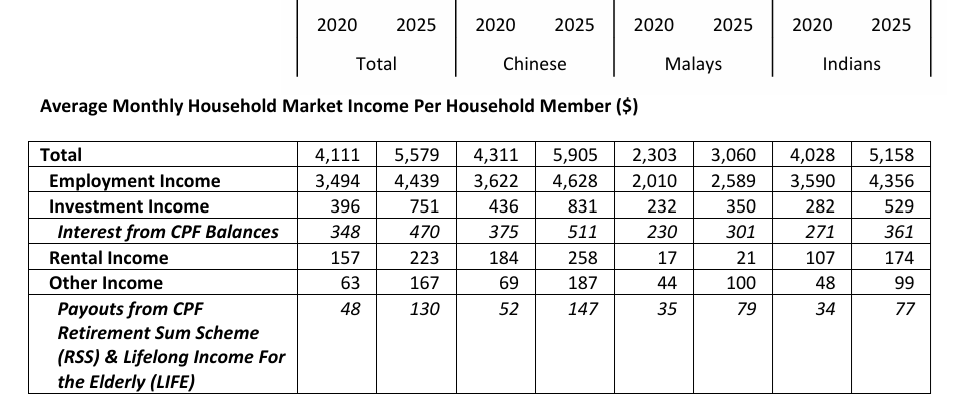
Another notable trend is that there is an increase in the proportion of household market income coming from investment income, rental income and other sources. “Investment income” includes interest from CPF balances, while “other income” includes payouts from the CPF Retirement Sum Scheme and CPF LIFE.
When looking at average monthly household market income per household member in 2025, Chinese households earned 14.1% of their income from investments, 4.4% from rental income and 3.2% from other income.
Malay households, per member, earned 11.4% of their income from investments, 0.7% from rental, and 3.3% from other income sources.
Indian households, per member, earned 10.3% of their income from investments, 3.4% from rental income, and 1.9% from other income.
#5 Households Staying In HDB Flats Decreased Slightly Between 2020 And 2025
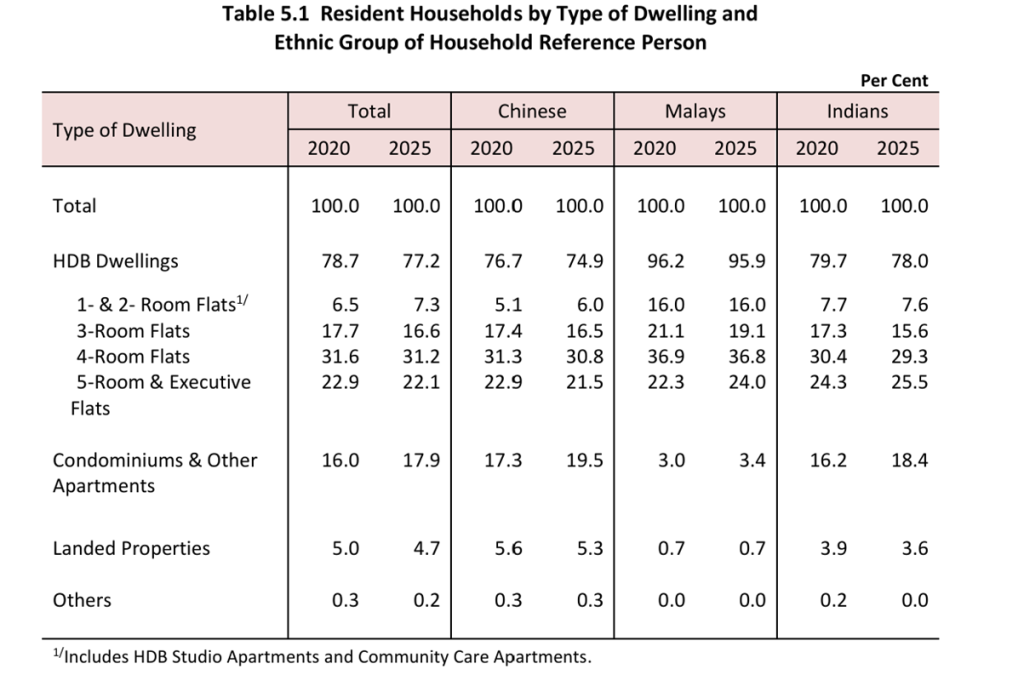
While the majority of resident households in Singapore live in HDB flats, with 31.2% living in 4-Room flats, the proportion has decreased since 2020, from 78.7% to 77.2%.
All three major ethnic groups saw an increase in the proportion living in condominiums and other apartments between 2020 and 2025.
#6 Home Ownership Remains High
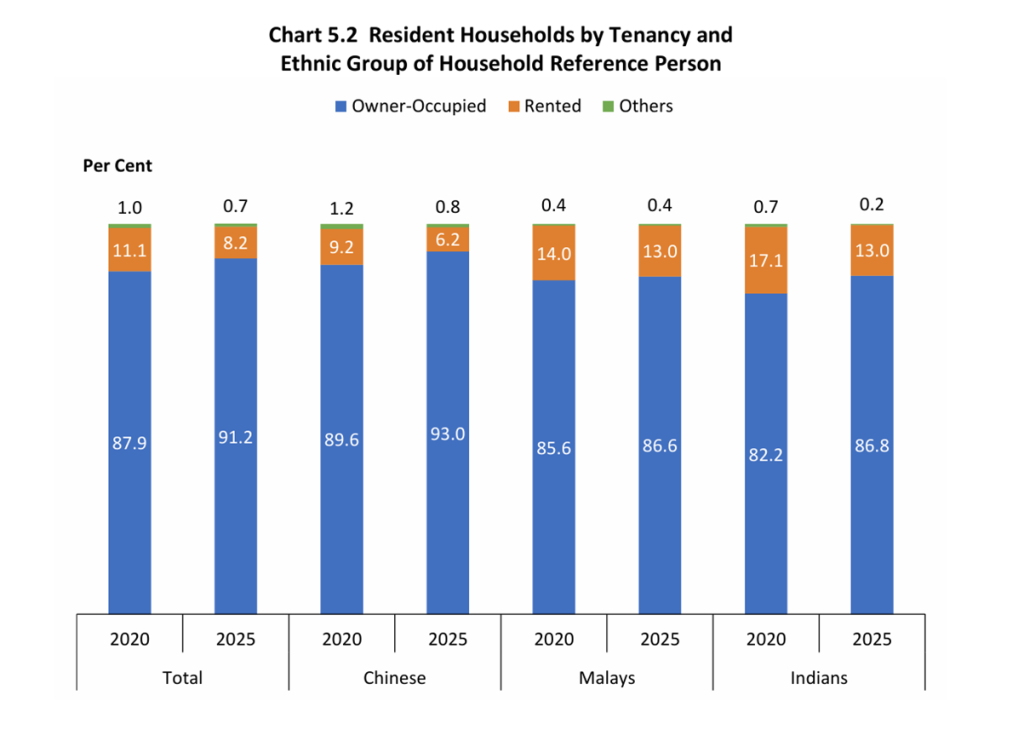
The proportion of owner-occupied households has increased since 2020, from 87.9% to 91.2% in 2025. The proportion of owner-occupied households was higher among Chinese households, at 93%, than among Malay and Indian households, which increased since 2020 to 86.6% and 86.8% respectively.
#7 Larger Proportion Of Married Couples In The Workforce
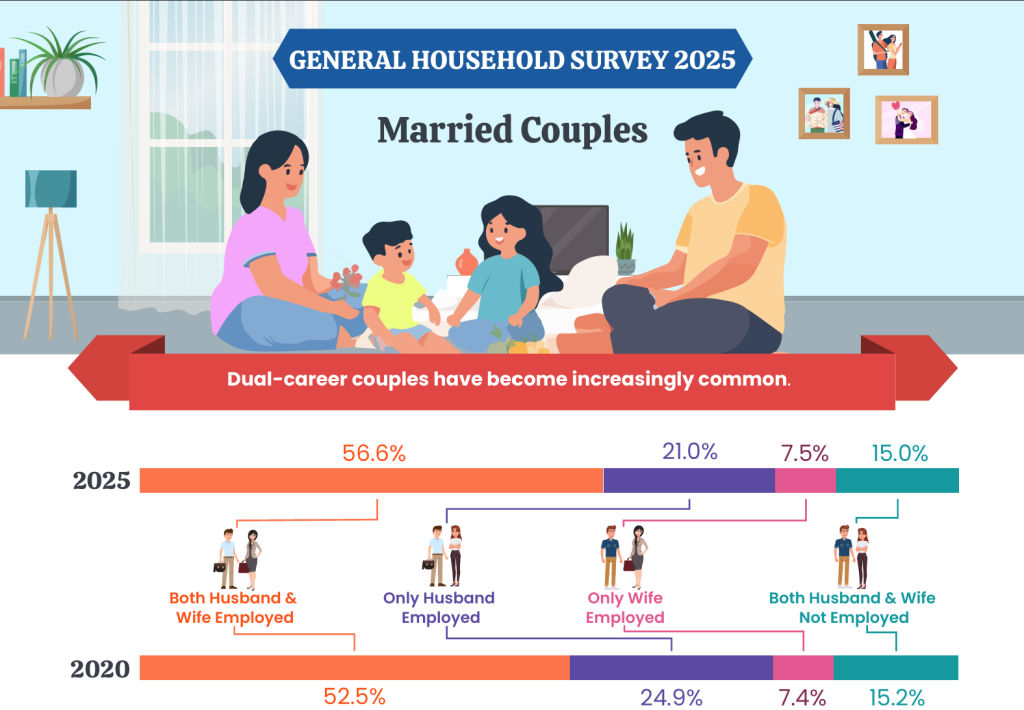
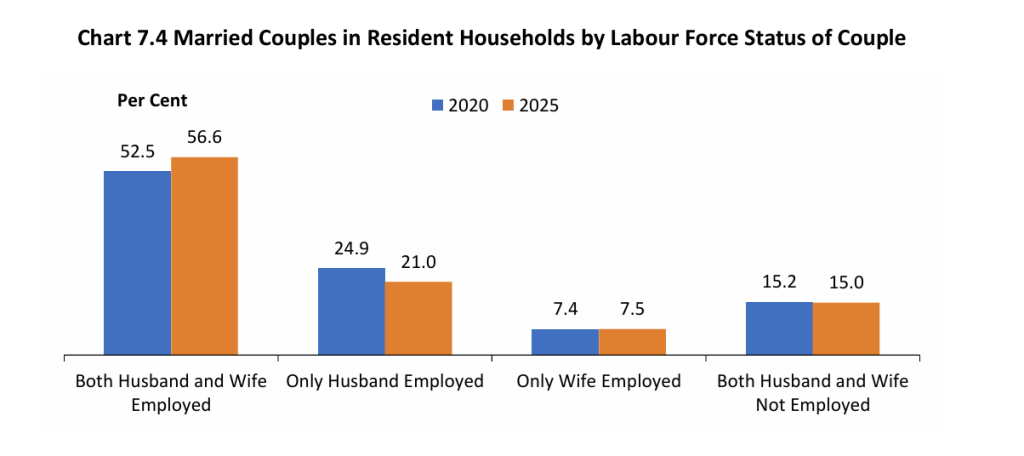
The proportion of married couples in which the wife is employed has increased from 60% in 2020 to 64% in 2025. This is mostly seen in the rise of dual-career couples, where both husband and wife are employed. While they made up 52.5% of married couples in 2020, this has now risen to 56.6% in 2025.
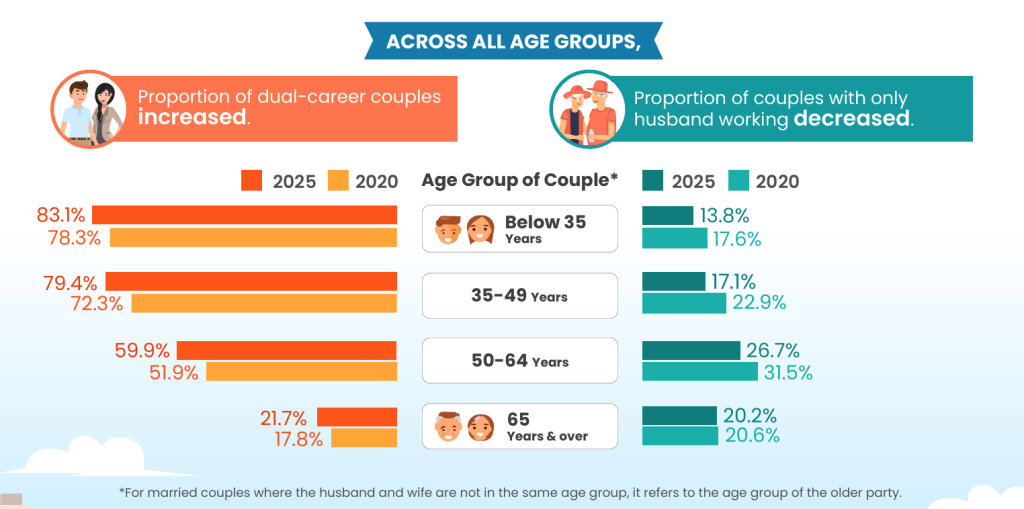
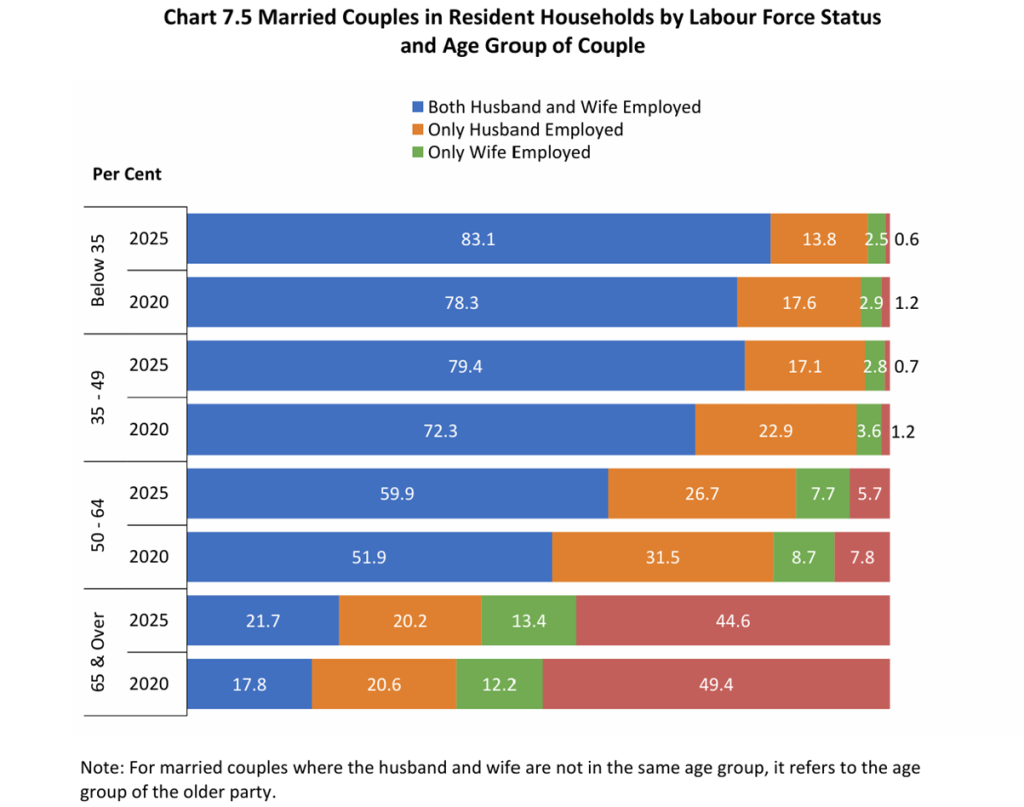
This rise corresponds with women staying in the workforce longer. There is a higher proportion of dual-career couples across all age groups, with the biggest changes from 2020 to 2025 seen among couples where the older partner is between 35 and 49 years old and between 50 and 64 years old.


Budgeting 101
7 Ways Being Frugal Is Different From Being Cheap


Street Smart
Singapore Gym Membership Price Guide (2026 Edition)


Street Smart
Singapore Gym Membership Price Guide (2026 Edition)


