
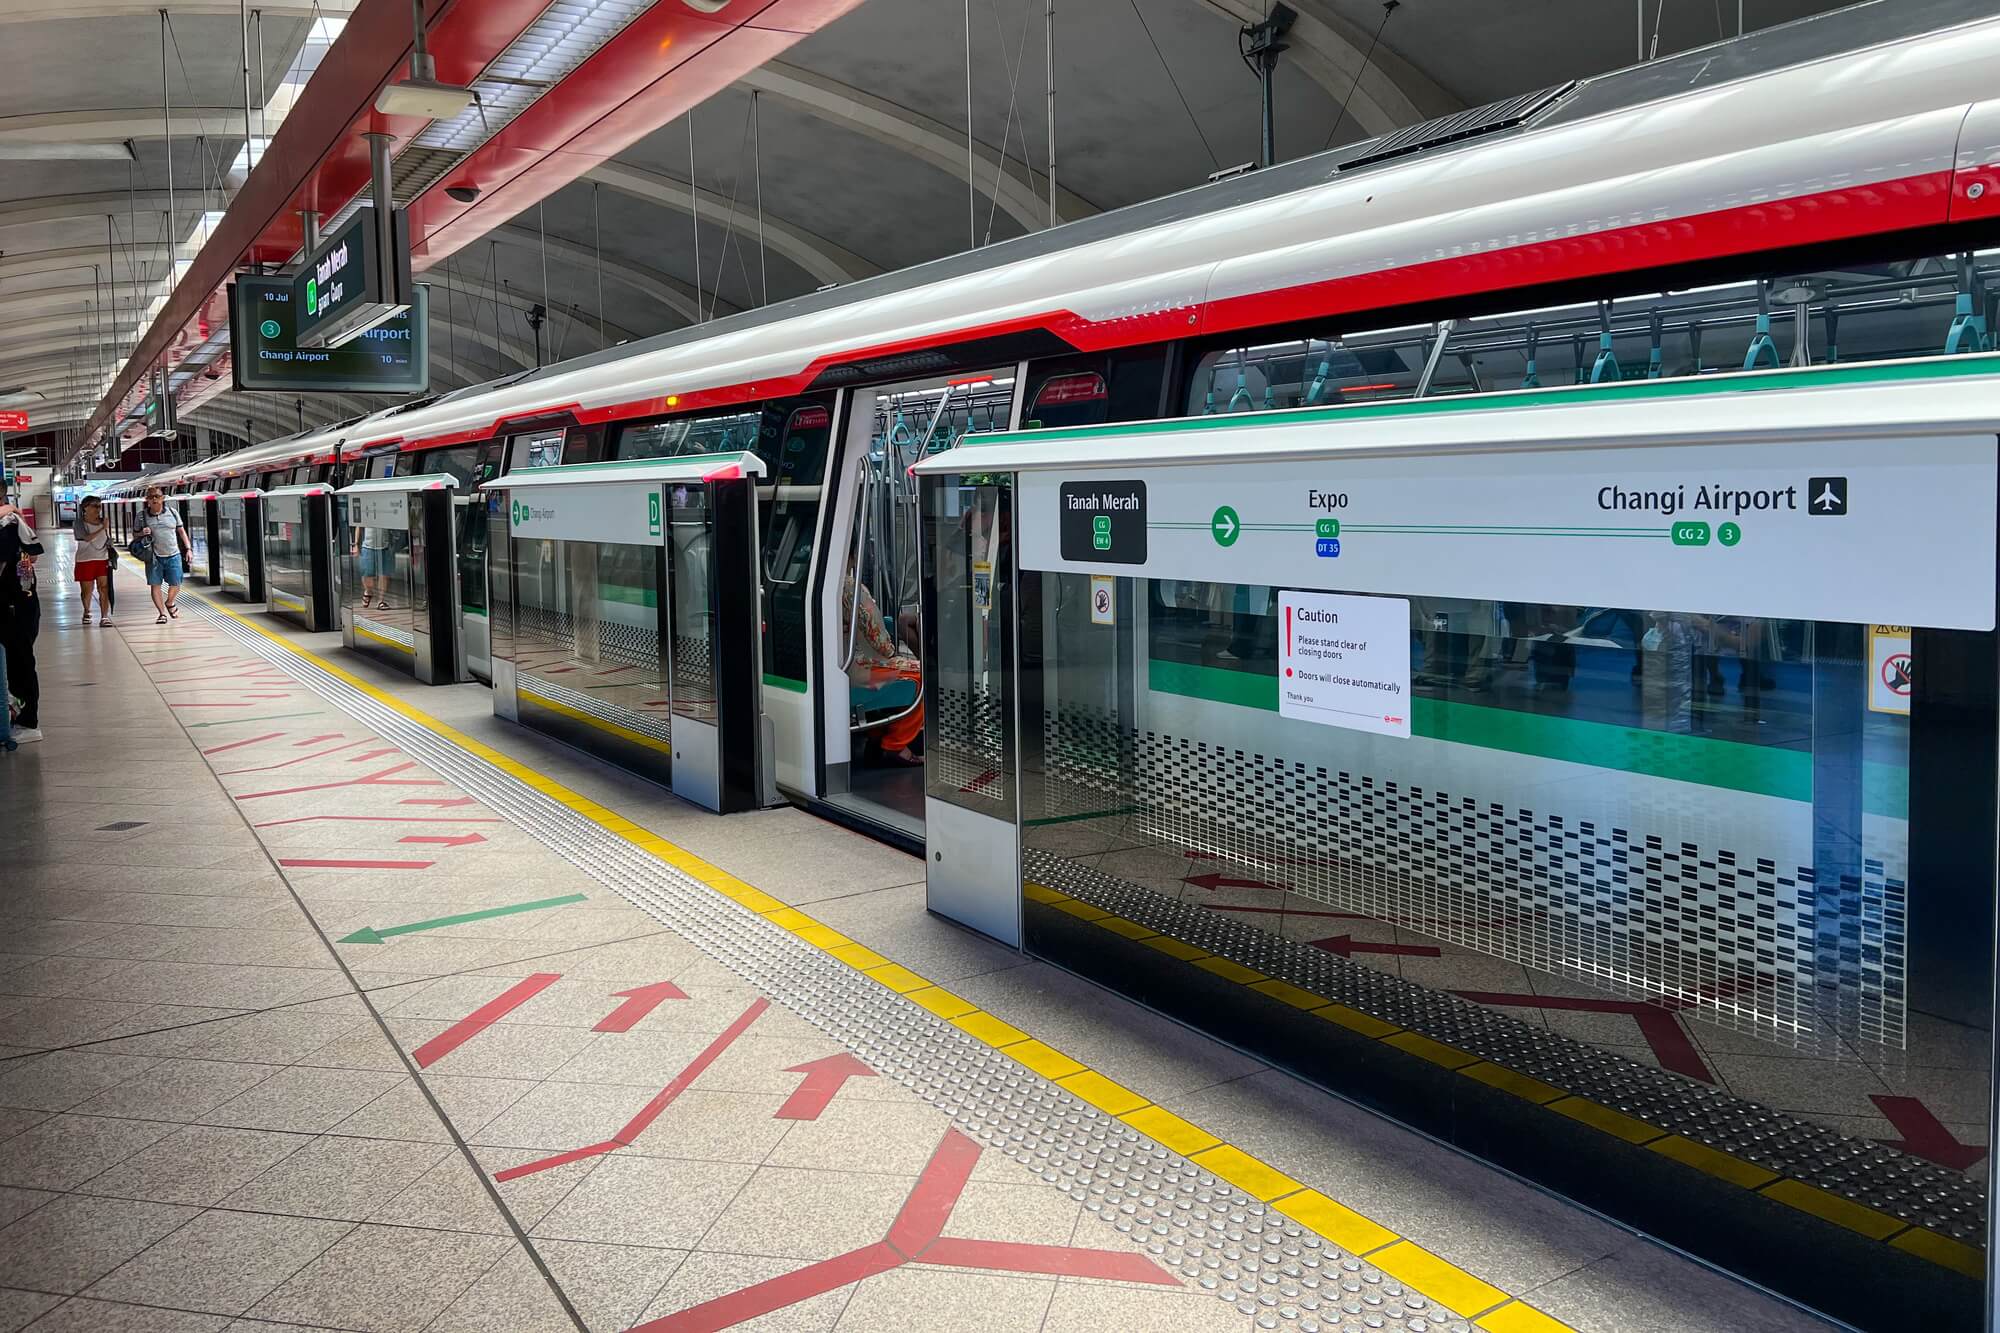
Singapore’s General Household Survey is published every 10 years and offers a mid-decade snapshot on a broad variety of topics. One of these is transport, and the latest edition, published in June 2026, goes into further detail on how employed residents travel to work that any of its predecessors.
All charts and data below are taken from the General Household Survey 2025 report.
Read Also: 7 Interesting Financial Trends We Spotted in Singapore’s General Household Survey 2025
#1 Downtown, Queenstown And Geylang Have The Most Employed Residents
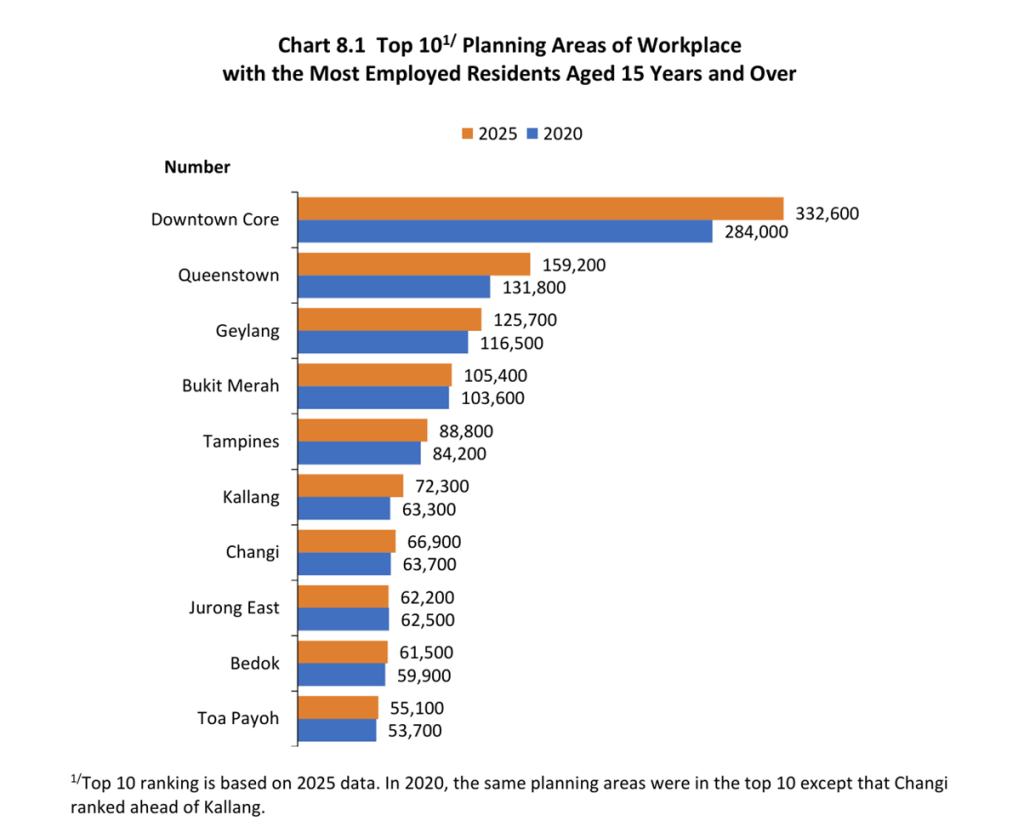
The top 10 planning areas with the most employed residents remained the same between 2020 and 2025. Unsurprisingly, Singapore’s Downtown Core has the highest number of employed residents, with 332,600 in 2025. This is 14% of Singapore’s resident workforce, and more than Queenstown and Geylang combined.
#2 Downtown Core Is The Main Workplace Destination For Residents Across The Island
For the first time, the 2025 report also revealed that the Downtown Core accounted for 10% to 19.9% of the resident workforce in each of Singapore’s five planning regions: Central, East, North, North-East, and West.
| Planning Region | Number | Proportion Of Employed Residents In Planning Region |
| Central | 102,100 | 19.9% |
| East | 55,300 | 13.8% |
| North | 33,800 | 10.0% |
| North-East | 79,500 | 14.0% |
| West | 61,900 | 11.1% |
In other words, regardless of where Singaporeans live, the largest share of the resident workforce in each planning region works in the Downtown Core.
Read Also: How Much Does It Cost To Go To Work In The Office Each Day In Singapore
#3 Excluding The Downtown Core, Most Residents Work Relatively Close To Home
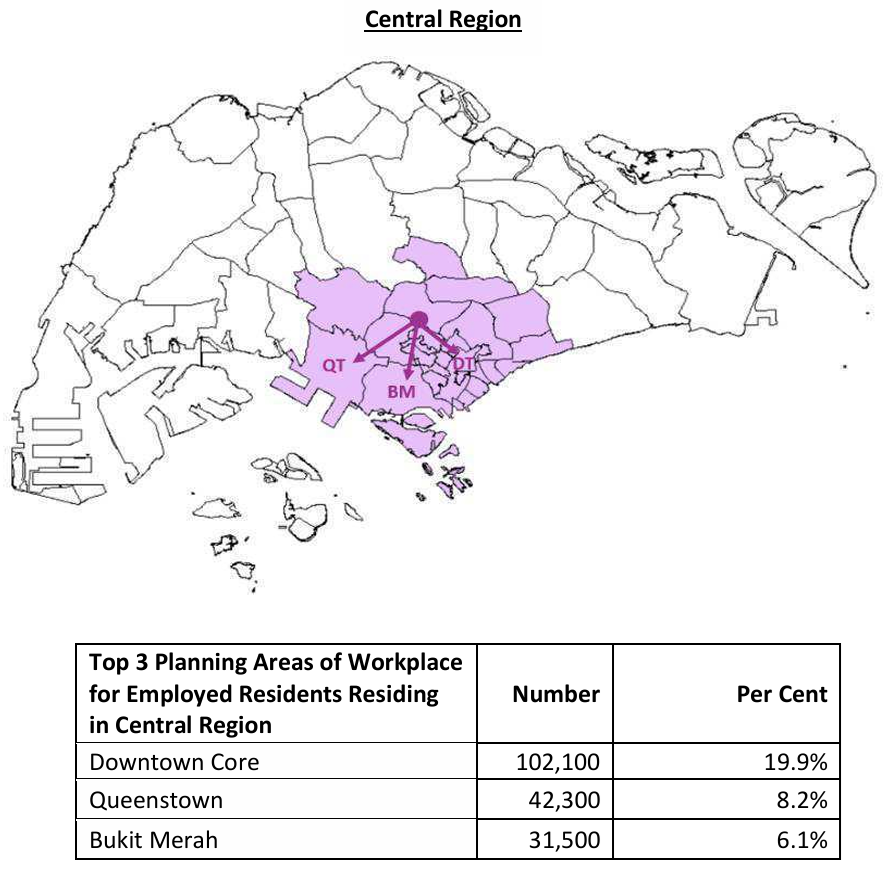
Unsurprisingly, employed residents in Singapore tend to choose to work as close to home as possible. Those living in the Central Region work in Queenstown and Bukit Merah.
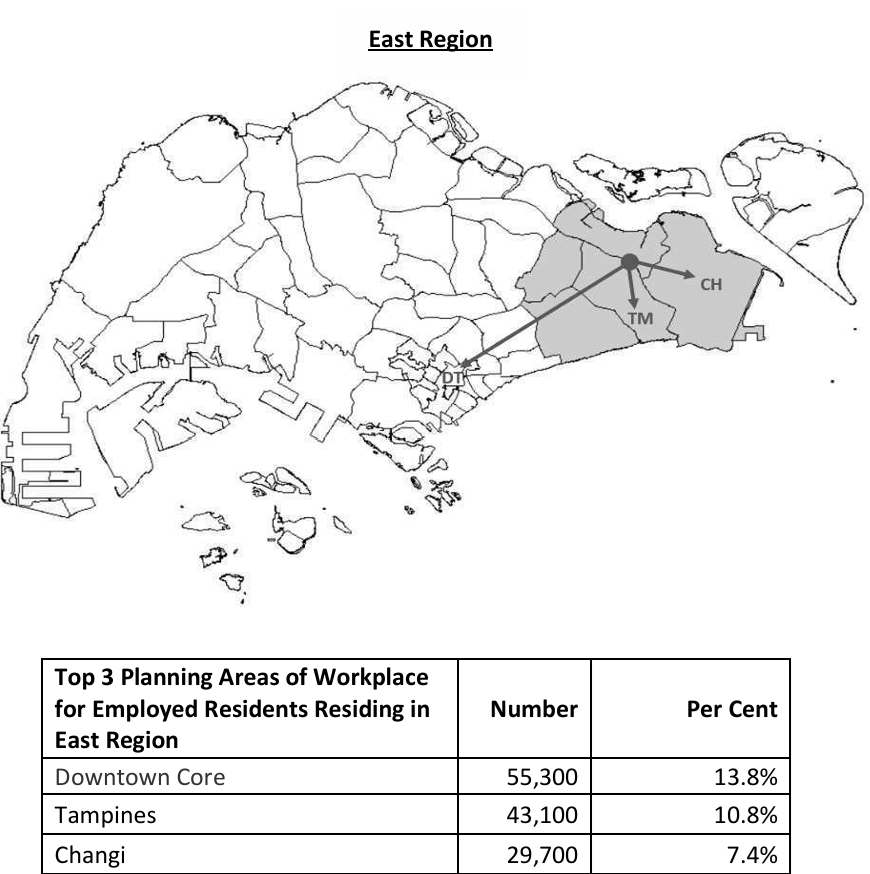
While those living in the East work in Tampines and Changi, and those living in the North work in Woodlands and Yishun.
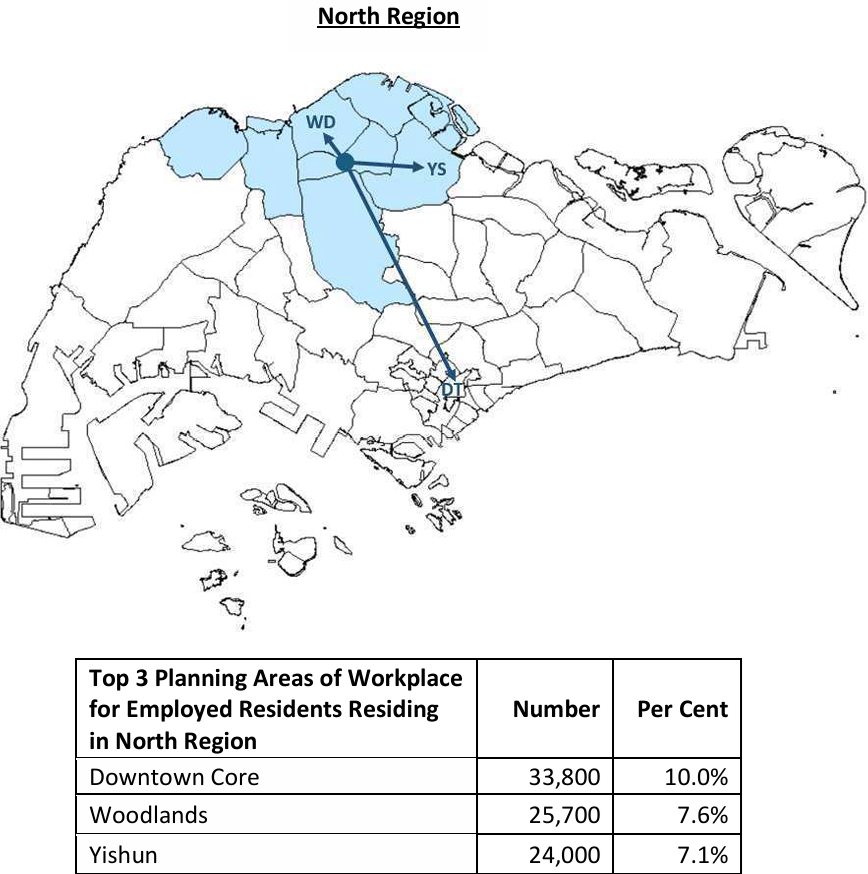
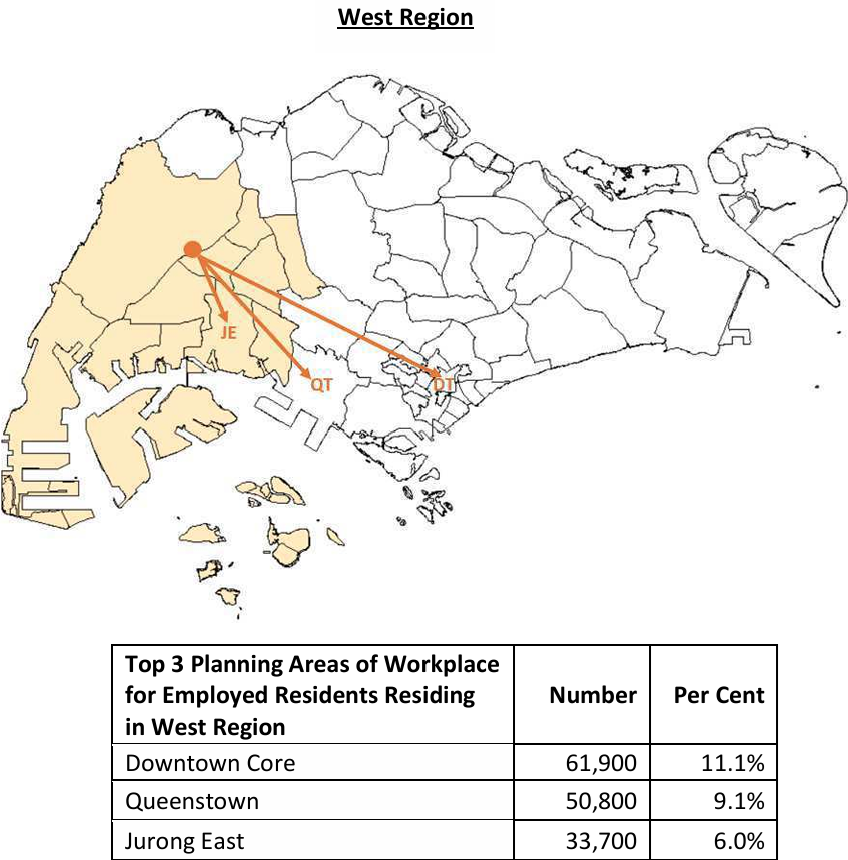
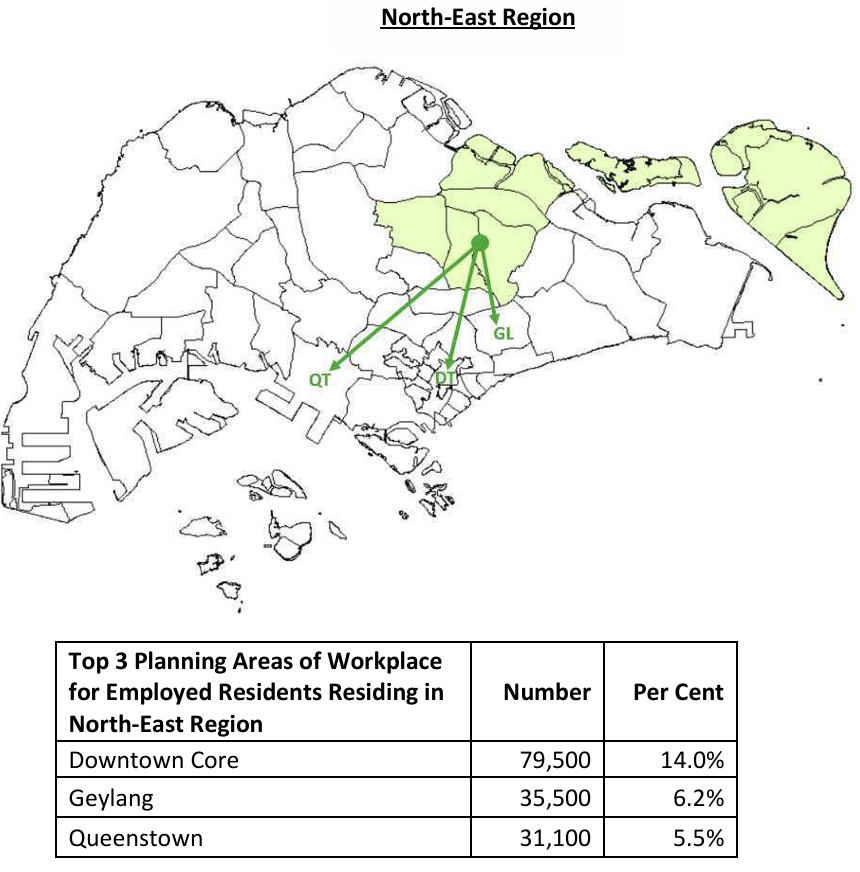
The exceptions to the rule are employed residents in the West, who work in Queenstown (which is technically considered part of the Central Region) and Jurong East, and employed residents in the North-East, most of whom travel out of their region to work in Geylang and Queenstown.
#4 Public Transport Remains The Preferred Mode Of Transport To Work
The proportion of employed residents taking public buses, MRT, or a combination of public transport modes in 2025 is 60.1%. This is up from 57.7% in 2020, and 58.2% in 2015.
Notably, there’s been an increase in the proportion of employed residents who use only the MRT or a combination of the MRT and other modes. This increased usage has been a trend since 2010. Over the same period, the proportion that used public buses as the only mode of transportation to work declined. The proportion that used cars as the only mode of transportation to work also decreased over past decade.
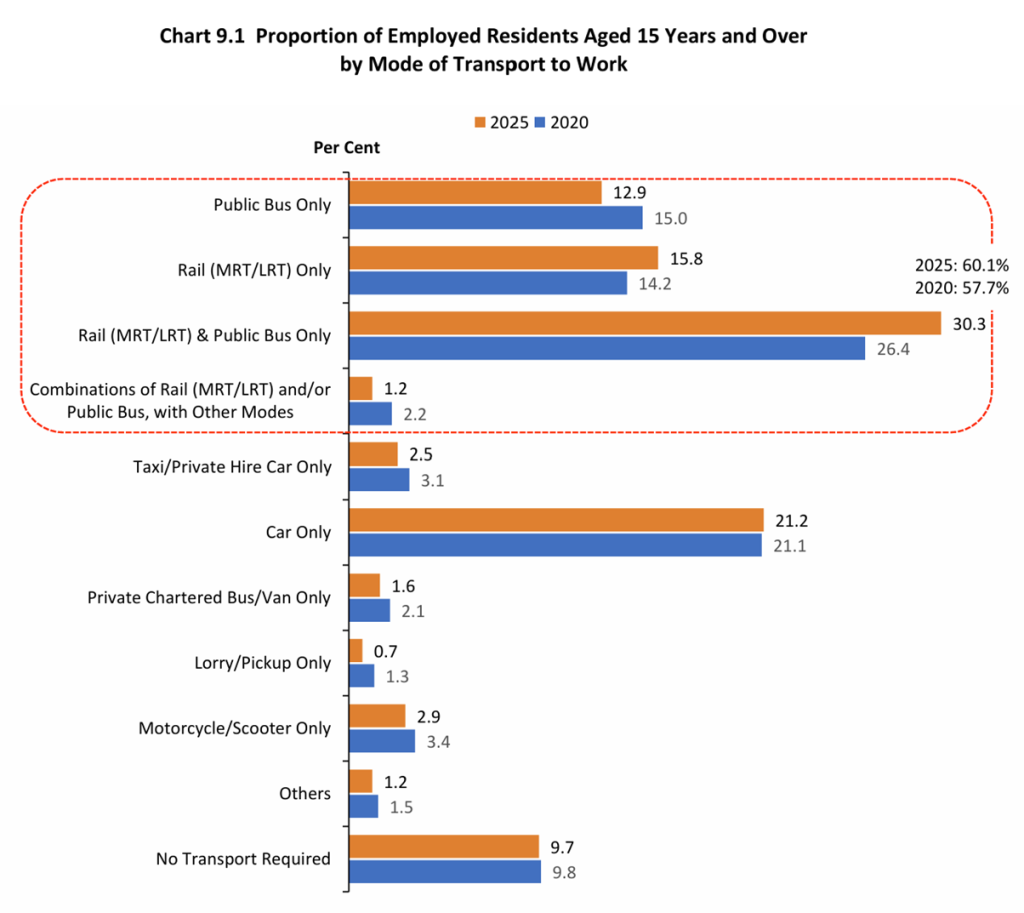
This trend should not come as a surprise, as they coincide with the launches of the Circle Line in 2009, the Downtown Line in 2013, and the Thomson-East Coast Line in 2020. With the upcoming launches of the Jurong Region Line and Cross Island Line over the next decade, we can expect this preference for MRT usage to work to grow even more.
#5 Median Commute Times Have Gotten Slightly Shorter
Despite the new MRT lines, what may come as a surprise is that the median commute time to work has remained largely unchanged from 2020 to 2025. Travel time includes time spent waiting for public transport, as well as walking to the bus stop or MRT station.
In 2025, the median travelling time to work for public transport is 45 minutes.
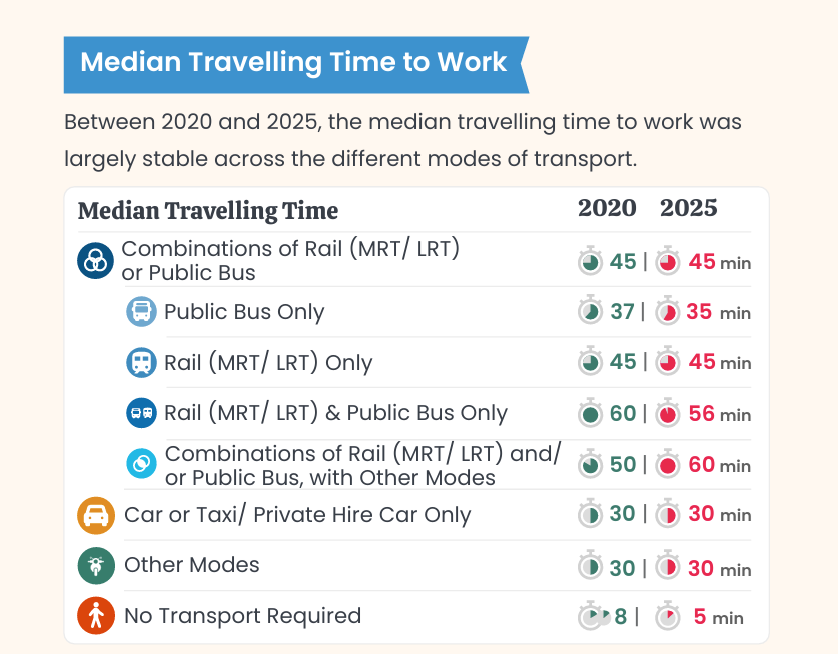
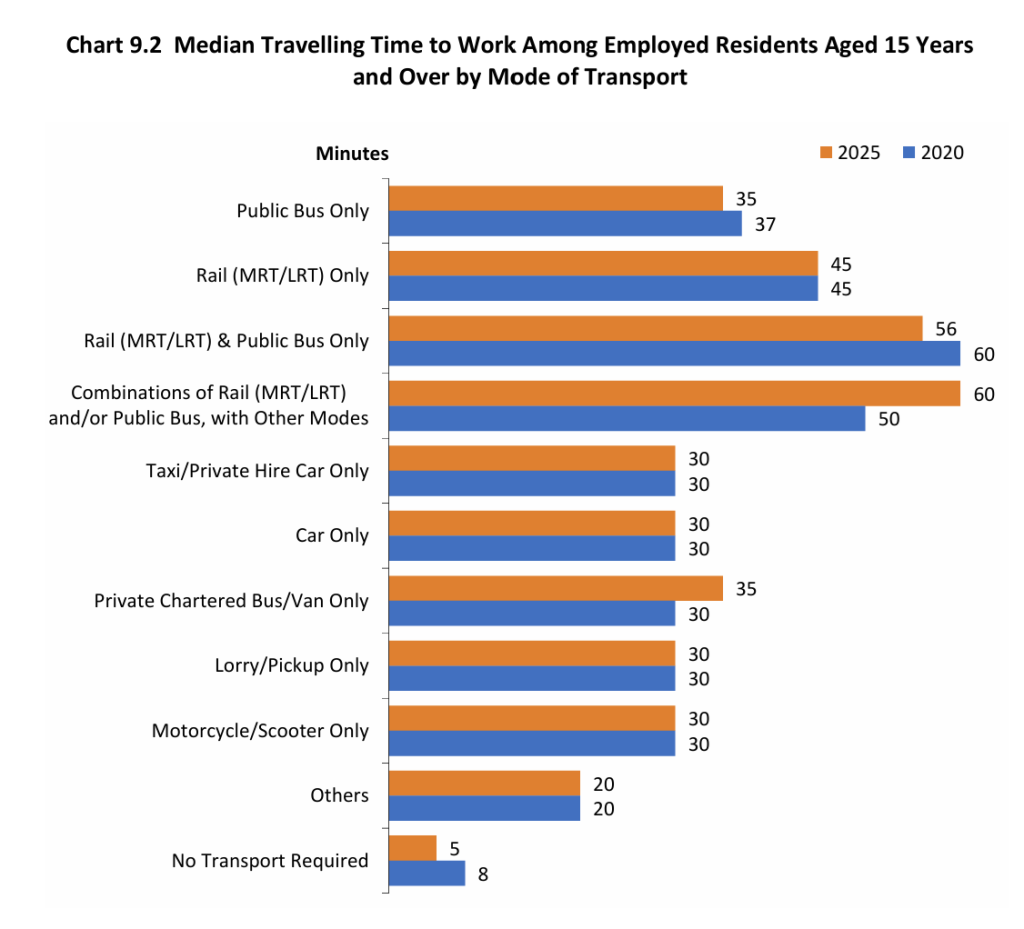
In other words, if you are taking more than 45 minutes to get to your workplace each day, you are spending more time than half the resident workforce on your daily commute.
#6 Ideally You Should Work Near Where You Live
With the majority of employed residents in Singapore working in the Downtown Core, it’s unsurprising that the further away from the Central Region you live, the longer your median travel time to work is.
Residents staying in Sembawang spent an average of 50 minutes travelling to work, the longest among all the planning areas. In contrast, those in Tanglin took only an average of 25 minutes to travel to work.
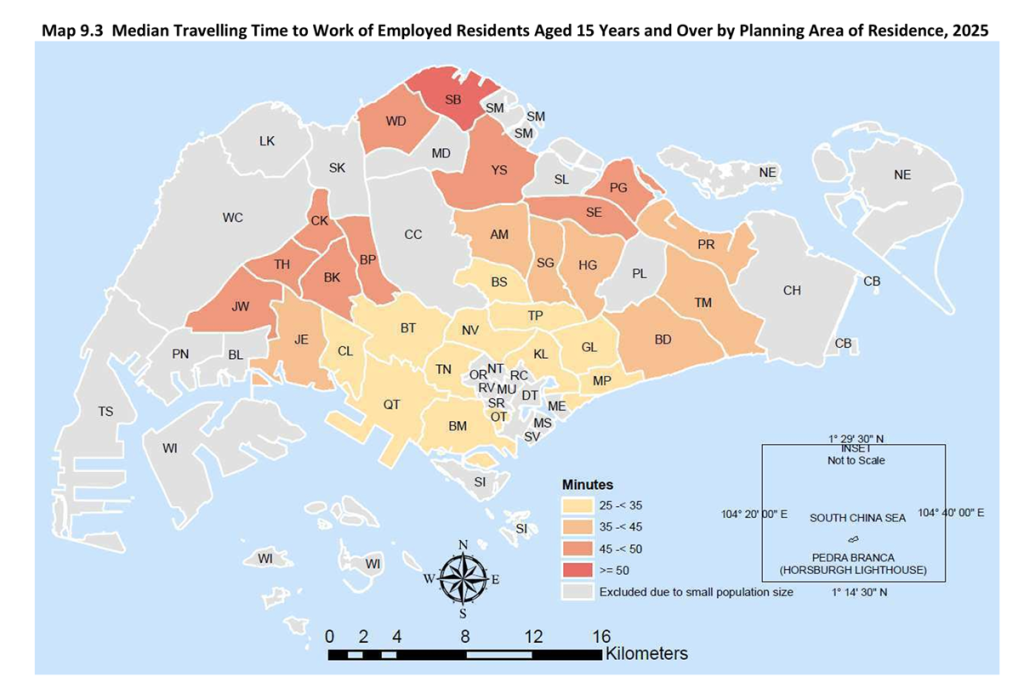
As Singapore develops its decentralisation strategy, as revealed in Master Plan 2025, with initiatives such as the Jurong Lake District and Jurong Innovation District in the West, the Punggol Digital District in the North-East, and the Northern Gateway, we’ll hopefully see a different map in the next General Household Survey in 2036.
Read Also: URA Draft Master Plan 2025: How The West Will Become More Connected And Future-Ready
Advertiser Message
Thinking Of Switching Brokers Or Consolidating Your Holdings?
Tiger Brokers is currently running a transfer-in campaign where eligible clients can receive an iPhone 17 Pro Max* when they transfer in their assets.
For SGX investors, there is also a CDP Transfer promotion with 0* commissions on Singapore stocks.
Find out more here. *T&Cs apply.




Budgeting 101
7 Ways Being Frugal Is Different From Being Cheap


Street Smart
Singapore Gym Membership Price Guide (2026 Edition)


Street Smart
Singapore Gym Membership Price Guide (2026 Edition)


