
This article was written in collaboration with Webull. All views expressed in this article are the independent opinion of DollarsAndSense.sg based on our research, are purely for informational purposes, and should not be relied upon as financial advice. DollarsAndSense.sg is not liable for any financial losses that may arise from any transactions, and readers are encouraged to do their own due diligence. You can view our full editorial policy here.
For many investors, a Regular Savings Plan (RSP) is one of the easiest ways to build your portfolio. Instead of trying to predict where markets will move next, an RSP allows you to invest in the markets regularly – removing guesswork and emotions, and instilling long-term discipline.
This simple habit enables you to dollar cost average (DCA) into the financial markets. When markets rise, your RSP will buy fewer units because prices are higher. When markets fall, you buy more units at lower prices.
Over time, this helps smooth out the cost of your investments. Traditionally, RSP is done by investing a fixed amount each month, regardless of how markets move.
But, some investors may prefer more flexibility. When markets trend lower, you may want to increase your investment amount – on top of buying more units due to lower prices. Conversely, when the market is higher, you may want to scale back your investment amount as valuations become more expensive.
This is also known as a Dynamic RSP.
What Is A Dynamic RSP?
A Dynamic RSP works very similarly to a traditional RSP, but adjusts the monthly investment amount based on market trends. To see how this can impact your investments, we will use MAS-regulated, low-cost brokerage platform Webull’s Dynamic RSP example.
Webull is currently the only platform in Singapore offering a Dynamic RSP. It gives investors a unique, automated way to respond to market movements. You can try out this innovative feature by opening a Webull SG account.
Webull’s Dynamic RSP determines whether the market is trending up or down, stating that:
If the previous closing price is above the benchmark moving average, you invest a lower amount; and if the previous closing price is below the benchmark moving average, you invest a higher amount.
How much you end up investing depends on 3 things: 1) the benchmark you use; 2) how long of a moving average you look at; and 3) the multiplier effect on your designated investment amount.
Webull allows investors to choose a benchmark of either:
– S&P 500
– NASDAQ
– Dow Jones Industrial (DJI)
– Targeted Investment Symbol
Apart from using the moving average of the particular investment you made, you can also choose to follow the broader market movements, using the S&P 500, NASDAQ or DJI.
You can choose a moving average period of either:
– 120-Day
– 250-Day
– 300-Day
This means whether you invest more money or less money can depend on average price movements over the past 120-day, 250-day or 300-day periods. Typically, a longer period means less volatility as it takes average prices over more days into consideration.
The multiplier effect can range from half of your designated investment to double the amount you want to invest:
| When benchmarks of previous close are higher than the moving average: | Multiplier on your Designated Investment Amount |
| (0%, 1%) | 100% |
| (1%, 3%) | 90% |
| (3%, 6%) | 80% |
| (6%, 10%) | 70% |
| (10%, 20%) | 60% |
| >20% | 50% |
| When benchmarks of previous close are lower than the moving average: | Multiplier |
| (0%, 1%) | 100% |
| (1%, 3%) | 120% |
| (3%, 6%) | 140% |
| (6%, 10%) | 160% |
| (10%, 15%) | 180% |
| >15% | 200% |
If your designated monthly RSP amount is US$200, and the price of your investment falls 4% compared to your chosen benchmark moving average, Webull’s Dynamic RSP will invest US$200 × 140% = US$280.
Instead, if prices rise 4% above the chosen benchmark moving average, you will end up investing US$200 x 80% = US$160.
In other words, you don’t just buy more or fewer units due to price changes, but you actually invest a larger or smaller sum to magnify this effect based on the price trend of your chosen benchmark moving average.
Over time, this allows you to progressively accumulate more when the market is cheaper, and stay incrementally more cautious when the market is expensive.
Traditional RSP vs Dynamic RSP: How Much Of A Difference Does It Make?
Let’s track a hypothetical 12 months of market movement, and how this may affect your investments – using a traditional RSP versus a dynamic RSP.
In a traditional RSP, you invest the same amount across the entire period.
| Month | Share price | Traditional RSP | Number Units Bought |
| Jan | US$10.00 | US$200 | 20.0 |
| Feb | US$11.00 | US$200 | 18.2 |
| Mar | US$12.00 | US$200 | 16.7 |
| Apr | US$9.00 | US$200 | 22.2 |
| May | US$8.00 | US$200 | 25.0 |
| Jun | US$7.00 | US$200 | 28.6 |
| Jul | US$6.00 | US$200 | 33.3 |
| Aug | US$8.00 | US$200 | 25.0 |
| Sep | US$9.00 | US$200 | 22.2 |
| Oct | US$13.00 | US$200 | 15.4 |
| Nov | US$12.00 | US$200 | 16.7 |
| Dec | US$10.00 | US$200 | 20.0 |
| End | Average Price: US$9.58 | US$2,400 | 263.2 |
The number of units are rounded to 1 decimal place.
In this hypothetical 12-month scenario, you equally spread out an investment of US$2,400, and buy 263.2 units of the investment due to monthly price changes. This gives you an average price of US$9.58 per unit.
Despite prices staying “stagnant” from a year-on-year perspective, you are better off investing regularly each month, compared to lump sum investing – which would give you 240 units at the start of the year.
Now, let’s look at how your investments would have went if you used Dynamic RSP instead:
| Month | Share Price | Share Price VS 120-day Moving Average | Multiplier Effect | Dynamic RSP (US$200 x Multiplier) | Number Units Bought |
| Jan | US$10.00 | +8.3% | 0.7 | US$140 | 14.0 |
| Feb | US$11.00 | +16.0% | 0.6 | US$120 | 10.9 |
| Mar | US$12.00 | +22.2% | 0.5 | US$100 | 8.3 |
| Apr | US$9.00 | -11.3% | 1.8 | US$360 | 40.0 |
| May | US$8.00 | -20.0% | 2.0 | US$400 | 50.0 |
| Jun | US$7.00 | -26.3% | 2.0 | US$400 | 57.1 |
| Jul | US$6.00 | -36.8% | 2.0 | US$400 | 66.7 |
| Aug | US$8.00 | -9.0% | 1.6 | US$320 | 40.0 |
| Sep | US$9.00 | +8.0% | 0.7 | US$140 | 15.6 |
| Oct | US$13.00 | +66.0% | 0.5 | US$100 | 7.7 |
| Nov | US$12.00 | +41.2% | 0.5 | US$100 | 8.3 |
| Dec | US$10.00 | +9.1% | 0.6 | US$120 | 12.0 |
| End | Average price: US$9.58 | ~1.13 | US$2,700 | 330.6 |
The number of units are rounded to 1 decimal place.
The first thing to note is that you end up investing a different amount each month, which may be higher or lower than your designated amount. In this hypothetical scenario, you would invest US$2,700 – slightly more than the US$2,400 you would have allocated under a traditional RSP.
This will depend on the price movement of your investment, as well as your chosen benchmark. As you can see in the table above, you would invest less as the share price moves up (between Jan to Mar; and Sep to Nov), and more as the share price trends down (between Apr to Aug).
You will end up with 330.6 units in this hypothetical scenario. While you will have more units of the investment, you have also invested more compared to a traditional RSP.
As you invested different amounts each month, your average cost for each unit would be different from the average price of the stock in the year. In this scenario, your average cost is US$8.17 (i.e. US$2,700 / 330.6).
Should You Choose Dynamic RSP?
Whether you prefer a Dynamic RSP or traditional RSP, one thing remains the same: You need to fund your investment account consistently.
Doing your own manual calculations and top-ups each month can be tedious. With a Webull brokerage account, you can automate your monthly investments, so you never miss an investment. This is important as the strategy hinges on investing more when valuations are depressed.
Doing so, you also instil the discipline to invest in the long-term – always putting money into the markets regardless of whether it goes up or down.
As you may be able to tell, there will be months when you invest less than the designated amount, and also other months where you invest more. So, automating larger monthly top-ups than just the designated amount to your Webull account makes sense.
One consideration investors will have when doing this is that their funds sit idle in the account. A major advantage in using Webull is that this never needs to happen.
You can keep your cash working via MONEYBULL – giving you a healthy return while your Dynamic RSP strategy determines when to plough your funds into the markets. As Webull’s cash management solution, MONEYBULL automatically sweeps your idle cash into low-risk cash market fund to earn competitive yields of up to 3.94%i 7-day USD yield p.a. or 1.12%ii 7-day SGD yield p.a.
Start Your Dynamic (or Traditional) RSP Journey With Webull
Whether you prefer the simplicity of a traditional RSP or the flexibility of a Dynamic RSP, Webull provides digital-first tools, ultra-low brokerage fees from US$0.50iii on US stocks/ETFs, and sign-up rewards that support your investment journey.
With Dynamic RSP on Webull, you potentially have a smarter way to invest at your fingertips, investing more when markets are cheaper and less when markets are more expensive – without losing out on returns on idle funds.
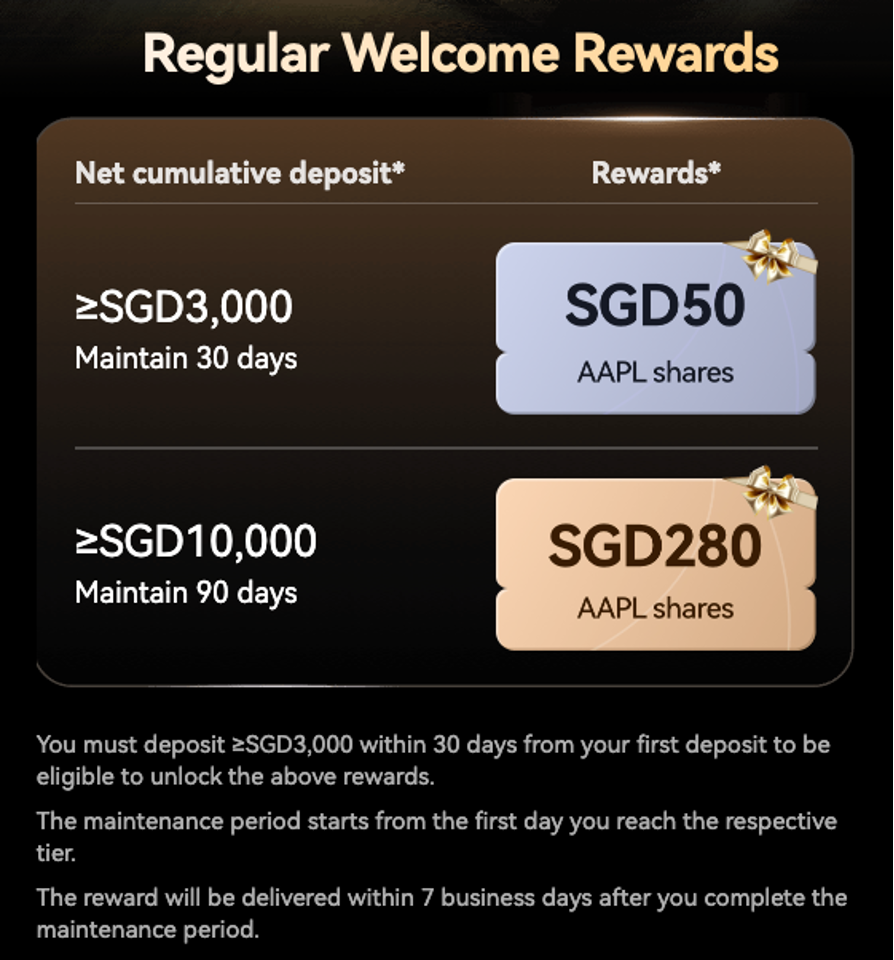
As the saying goes, the best time to start investing is yesterday; but the second-best time to start investing is today. Webull gives you even more incentive to start with attractive sign-up promotions. From now till 27 February 2026, new investors can look forward to getting up to S$280iv in free Apple shares when you maintain at least S$10,000 in your account for 90 days.
About Webull
Webull Securities (Singapore) Pte. Ltd. is regulated by the Monetary Authority of Singapore (MAS) and holds a Capital Markets Services (CMS) Licence under the Securities and Futures Act 2001. Its parent company is listed on Nasdaq, and Webull is a leading brokerage in the US.
Webull Singapore offers a diverse product suite, including stocks, ETFs, options, futures, mutual funds, and treasury bonds. Users can access the US, Singapore, Hong Kong, and China A-share markets through the Webull trading platform.
Enjoy 0 platform fees on US stocks and options, as well as HK stocks. New users also enjoy one year of commission-freeiv trading on SG stocks, REITs, warrants, and DLCs.
Webull Singapore’s trading costs are among the lowest in the local landscape, and its app features a clean, intuitive interface designed for both new and experienced investors.
Webull Corporation (NASDAQ: BULL) owns and operates Webull, a leading digital investment platform with over 50 million downloads and more than 25 million registered users. Webull provides 24/7 access to global financial markets through its network of licensed brokerages, operating in 14 markets across North America, Asia Pacific, Europe, and Latin America.
Sign up today: https://dollarsandsense.link/webull
i Figures shown are based on 3.94% 7-Day Yield P.A. of the USD Cash Fund in Moneybull as of 29 Oct 2025.
ii Figures shown are based on 1.12% 7-Day Yield P.A. of the SGD Cash Fund in Moneybull as of 29 Oct 2025.
iii The US Stocks/ETFs fees include commission fee and platform fee. The price of US$0.50 is subject to change at Webull’s discretion and is valid until updated. For regular and extended hours (04:00 –20:00 EST) only.
iv T&Cs apply. All investments involve risks and are not suitable for every investor. This advertisement has not been reviewed by the Monetary Authority of Singapore.
This article contains affiliate links. DollarsAndSense may receive a share of the revenue from your sign-ups. You can refer to our editorial policy here.


