
Stepping into 2022, the high inflation rate environment caused various central banks to rethink their easy monetary policy and are signalling their intention for interest rate hikes. As a result, REITs could incur higher finance expenses in this rising interest rate environment.
Furthermore, the ongoing Ukraine-Russia conflict also dampened overall market sentiments. As a result, we are seeing a broad base pullback in REITs in 2022 Year-to-Date.
How Singapore REITs Performed In 2022 Year-to-Date
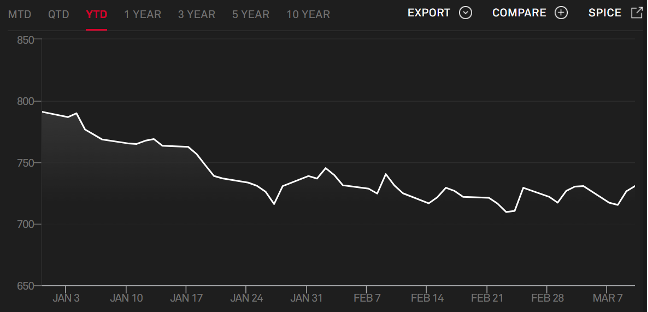
To get an overview of how Singapore REITs have done in 2022 Year-to-date, we look at how the iEdge S-REIT Leaders Index – measuring the performance of the most liquid REITs listed on the SGX in Singapore dollars – has performed.

Source: SGX
The iEdge S-REIT Leaders Index suffered a drop of around 3.3% from approximately $1,368 since the start of the year to $1,322 on 11 March 2022. Over the same period, the benchmark index, Straits Times Index (“STI”), rose by approximately 3.8% from $3,130 since the start of the year to $3,249 on 11 March 2022. This shows that S-REITs have underperformed against the broader market.
At the same time, the iEdge S-REIT Leaders Index saw significant volatility with the differences between its lowest and highest price for the 1st quarter standing at around $95. Overall, for the 1-year period, the index is still on a downtrend with some slight rebound recently.
Despite the underperformance, S-REITs managed to outperform their global peers, when compared against the S&P Global REIT Index. The index has fallen by about 8% year-to-date, much worse than the decline of just 3.3% for the iEdge S-REIT Leaders Index. This goes to show that S-REITs are more resilient as compared to their global peers.
Source: S&P Global REIT Index
How Individuals REITs In Singapore Performed In 1Q 2022
| No. | REITs, Stapled Securities And Other Trusts, And ETFs | Price (SGD)* | Forward Distribution Yield (%)** | YTD Total Returns (%)** |
| REITs and Stapled Securities | ||||
| Commercial/Office REITs | ||||
| 1 | Cromwell European REIT (SGX: CWBU) | EUR 2.240 | 6.4 | (10.1) |
| 2 | Elite Commercial REIT (SGX: MXNU) | GBP 0.650 | 7.0 | 1.2 |
| 3 | IREIT Global (SGX: UD1U) | 0.625 | 5.0 | (4.2) |
| 4 | Keppel REIT (SGX: K71U) | 1.200 | 4.1 | 6.1 |
| 5 | Keppel Pacific Oak US REIT (SGX: CMOU) | USD 0.720 | 8.4 | (7.9) |
| 6 | Manulife US REIT (SGX: BTOU) | USD 0.640 | 8.3 | (4.1) |
| 7 | OUE Commercial REIT (SGX: TS0U) | 0.405 | 6.5 | (5.9) |
| 8 | Prime US REIT (SGX: OXMU) | 0.750 | 7.2 | (7.1) |
| 9 | Suntec REIT (SGX: T82U) | 1.690 | 5.5 | 11.4 |
| Retail REITs | ||||
| 10 | BHG Retail REIT (SGX: BMGU) | 0.545 | 3.9 | (8.9) |
| 11 | CapitaLand Retail China Trust (SGX: AU8U) | 1.150 | 3.9 | (1.8) |
| 12 | Frasers Centrepoint Trust (SGX: J69U) | 2.290 | 5.2 | (0.8) |
| 13 | Lendlease Global Commercial REIT (SGX: JYEU) | 0.810 | 5.9 | (6.3) |
| 14 | Lippo Malls Indonesia Trust (SGX: D5IU) | 0.051 | 7.0 | (3.9) |
| 15 | Mapletree Commercial Trust (SGX: N2IU) | 1.840 | 5.3 | (8.0) |
| 16 | Mapletree North Asia Commercial Trust (SGX: RW0U) | 1.090 | 6.2 | (2.7) |
| 17 | Sasseur REIT (SGX: CRPU) | 0.850 | 8.3 | (1.2) |
| 18 | SPH REIT (SGX: SK6U) | 0.950 | 5.3 | (4.3) |
| 19 | Starhill Global REIT (SGX: P40U) | 0.600 | 6.5 | (7.2) |
| 20 | United Hampshire US REIT (SGX: ODBU) | USD 0.615 | 9.9 | (6.5) |
| Integrated REIT (Retail + Commercial) | ||||
| 21 | CapitaLand Integrated Commercial Trust (SGX: C38U) | 2.160 | 4.8 | 5.6 |
| Industrial REITs | ||||
| 22 | AIMS APAC REIT (SGX: O5RU) | 1.370 | 7.4 | (5.3) |
| 23 | Ascendas REIT (SGX: A17U) | 2.870 | 5.3 | (0.8) |
| 24 | ARA Logos Logistics Trust (SGX: K2LU) | 0.840 | 6.0 | (5.9) |
| 25 | EC World REIT (SGX: BWCU) | 0.740 | 8.3 | (3.9) |
| 26 | ESR-REIT (SGX: J91U) | 0.430 | 6.9 | (11.0) |
| 27 | Frasers Logistics & Commercial Trust (SGX: BUOU) | 1.460 | 5.3 | (5.3) |
| 28 | Keppel DC REIT (SGX: AJBU) | 2.240 | 4.4 | (8.3) |
| 29 | Mapletree Industrial Trust (SGX: ME8U) | 2.630 | 4.2 | (2.4) |
| 30 | Mapletree Logistics Trust (SGX: M44U) | 1.820 | 4.0 | (4.4) |
| 31 | Sabana Industrial REIT (SGX: M1GU) | 0.465 | 6.8 | 4.7 |
| Hospitality REITs | ||||
| 32 | ARA US Hospitality Trust (SGX: XZL) | USD 0.500 | 0.7 | 1.7 |
| 33 | Ascott Residence Trust (SGX: HMN) | 1.040 | 4.2 | 2.7 |
| 34 | CDL Hospitality Trust (SGX: J85) | 1.150 | 3.8 | (1.7) |
| 35 | Far East Hospitality Trust (SGX: Q5T) | 0.595 | 4.5 | 1.8 |
| 36 | Frasers Hospitality Trust (SGX: ACV) | 0.445 | 2.3 | (6.5) |
| Healthcare REITs | ||||
| 37 | First REIT (SGX: AW9U) | 0.295 | 8.9 | (1.1) |
| 38 | Parkway Life REIT (SGX: C2PU) | 4.660 | 3.1 | (8.9) |
| Other Property Trusts | ||||
| 39 | Ascendas India Trust (SGX: CY6U) | 1.200 | 6.5 | (12.3) |
| 40 | Dasin Retail Trust (SGX: CEDU) | 0.340 | 15.6 | (9.5) |
| REIT ETFs | ||||
| 43 | Lion-Phillip S-REIT ETF (SGX: CLR) | 1.024 | 5.0 *** | (2.99) *** |
| 44 | NikkoAM-Straits Trading Asia Ex Japan REIT ETF (SGX: CFA) | 1.064 | 4.6 *** | (2.49) *** |
| 45 | Phillip SGX APAC Dividend Leaders REIT ETF (SGX: BYJ) | 1.363 | 3.1 *** | (8.08) *** |
*Price (SGD) is based on 11th March 2022 closing price, with the currency in SGD unless otherwise stated
**Both Forward Distribution Yield and YTD Total Returns are derived from Morningstar
***YTD Total Returns for REIT ETF derived from Fundsupermart, Forward Distribution Yield derived from SGX’ SREITs & Property Trusts Chartbook – February 2022
3 Best Performing S-REITs
#1 Suntec REIT (11.4%)
#2 Keppel REIT (6.1%)
#3 CapitaLand Integrated Commercial Trust (5.6%)
Both Suntec REIT and Keppel REIT, which are from the office sector, are the best-performing S-REITs year-to-date. Meanwhile, CapitaLand Integrated Commercial Trust was also on the list, with a year-to-date return of 5.6%.
Suntec REIT’s outperformance may be derived from the higher gross revenue and distribution per unit achieved, due to the acquisition of The Minister Building, increased contribution from 477 Collins Street & 21 Harris Street, and lesser rent assistance at Suntec City Mall.
Meanwhile, Keppel REIT’s positive year-to-date return of 6.1% can be attributed to the year-on-year improvement in its overall financial figures, as a result of the full-year contribution from Victoria Police Centre and Pinnacle Office Park, as well as the latest acquisition of Keppel Bay Tower in May 2021.
CapitaLand Integrated Commercial Trust’s latest portfolio reconstitution strategy is one of the reasons which empowers them to maintain a positive performance. The disposal of JCUBE, which is one of the REIT’s smallest malls in the Jurong East region, will allow the manager to unlock value for shareholders and reinvest the proceeds into more attractive investment opportunities.
3 Worst Performing S-REITs
#1 Ascendas India Trust (-12.3%)
#2 ESR-REIT (-11.0%)
#3 Cromwell European REIT (-10.1%)
Ascendas India Trust came in as the worst-performing S-REITs with a year-to-date negative return of 12.3%. The underperformance may be explained by the lower distributable income in FY2021 and an unfavourable foreign exchange rate.
With ESR-REIT increasing its offer for ARA Logos, this has resulted in some concerns about paying a high premium for growth. Coupled with the uncertainty of whether the transaction will go ahead, this may have resulted in the fall in ESR REIT’s unit price year-to-date.
Lastly, Cromwell European REIT dipped 10% in the year-to-date. With the REIT’s asset primarily based in Europe, and a handful of properties in Slovakia and Poland that border Ukraine, investors might be relooking their exposure to the continent on the back of the Ukraine-Russia conflict.
3 REITS With Best Distribution Yield
#1 Dasin Retail Trust (15.6%)
#2 United Hampshire US REIT (9.9%)
#3 First REIT (8.9%)
The presence of an exceptionally high distribution yield could make these REITs an attractive investment opportunity. However, investors should look beyond this metric as the overall financial health and development will better determine the sustainability of their dividend yield. Furthermore, a sharp fall in unit price could artificially inflate the REITs’ distribution yield, which will ultimately distort investors’ decisions.
Despite having a distribution yield of more than 15%, Dasin Retail Trust’s unit price has been on a decline since the start of the year. This may be attributed to the ongoing concern of the maturity of its offshore loans due this year.
The recent decline in unit price for United Hampshire US REIT resulted in an increase in its dividend yield to nearly 10%. Despite the concern of a high distribution yield, the REIT managed to declare a distribution per unit of 6.1 US cents, which is higher than the forecasted figure in their IPO prospectus. Furthermore, its overall portfolio occupancy rate remained resilient at 95.6%, coupled with a long weighted average lease expiry (“WALE”) of 8.0 years.
Finally, First REIT came in 3rd with a distribution yield of 8.9%. With the successful restructuring of its master lease agreement and lower gearing ratio, First REIT managed to stabilise its operations in FY2021. Upon the introduction of First REIT 2.0 Growth Strategy, they have taken the first strategic step towards the acquisition of 12 nursing homes in Japan.


